Immigrants from Japan vs German Russian 7th Grade
COMPARE
Immigrants from Japan
German Russian
7th Grade
7th Grade Comparison
Immigrants from Japan
German Russians
96.5%
7TH GRADE
95.5/ 100
METRIC RATING
118th/ 347
METRIC RANK
96.7%
7TH GRADE
98.6/ 100
METRIC RATING
100th/ 347
METRIC RANK
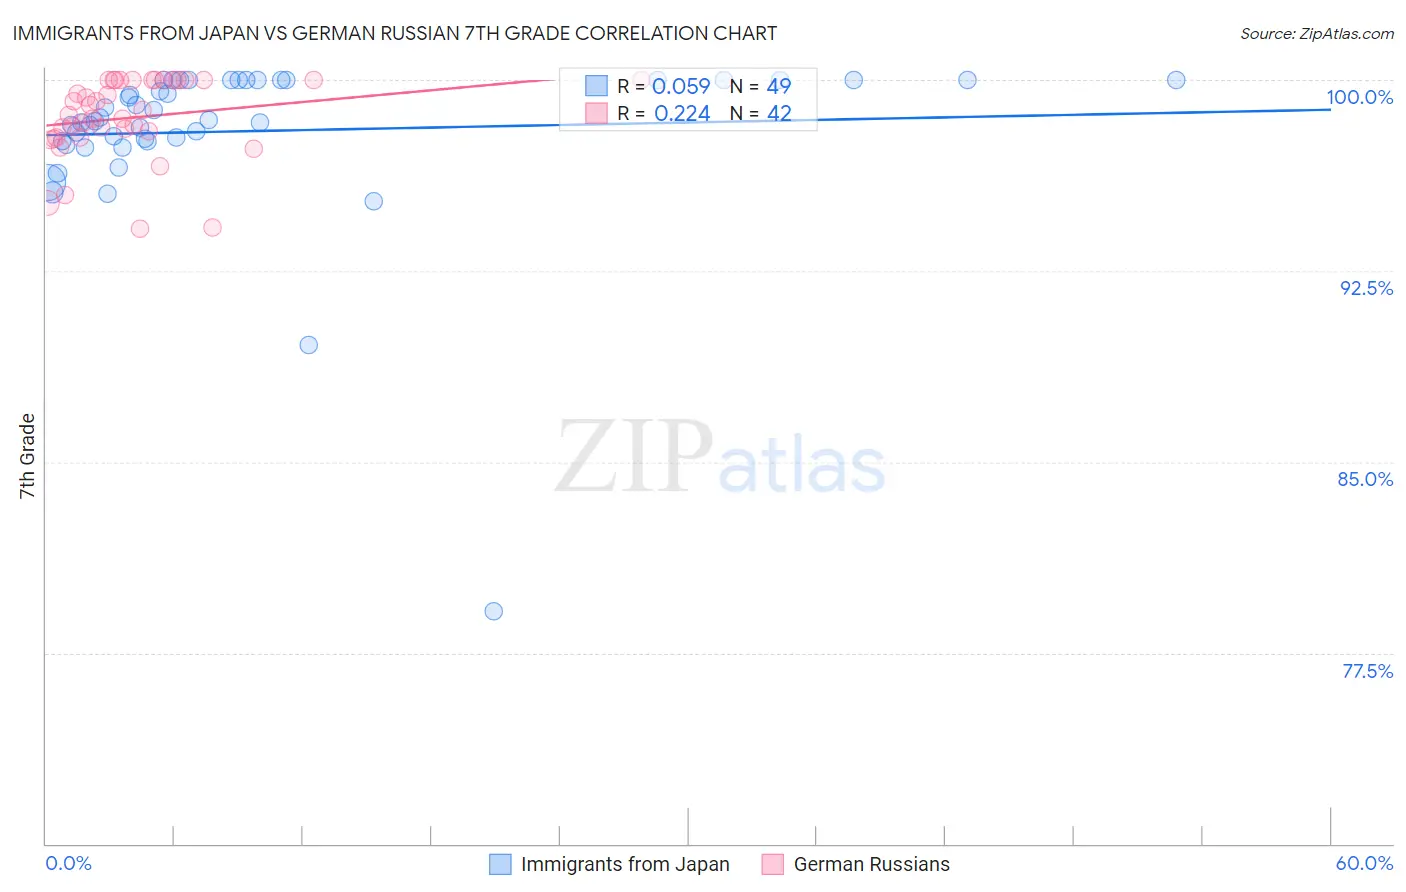
Immigrants from Japan vs German Russian 7th Grade Correlation Chart
The statistical analysis conducted on geographies consisting of 340,148,942 people shows a slight positive correlation between the proportion of Immigrants from Japan and percentage of population with at least 7th grade education in the United States with a correlation coefficient (R) of 0.059 and weighted average of 96.5%. Similarly, the statistical analysis conducted on geographies consisting of 96,461,520 people shows a weak positive correlation between the proportion of German Russians and percentage of population with at least 7th grade education in the United States with a correlation coefficient (R) of 0.224 and weighted average of 96.7%, a difference of 0.19%.
7th Grade Correlation Summary
| Measurement | Immigrants from Japan | German Russian |
| Minimum | 79.1% | 94.2% |
| Maximum | 100.0% | 100.0% |
| Range | 20.9% | 5.8% |
| Mean | 98.0% | 98.5% |
| Median | 98.4% | 98.7% |
| Interquartile 25% (IQ1) | 97.6% | 97.8% |
| Interquartile 75% (IQ3) | 100.0% | 100.0% |
| Interquartile Range (IQR) | 2.4% | 2.2% |
| Standard Deviation (Sample) | 3.3% | 1.6% |
| Standard Deviation (Population) | 3.3% | 1.6% |
Demographics Similar to Immigrants from Japan and German Russians by 7th Grade
In terms of 7th grade, the demographic groups most similar to Immigrants from Japan are Immigrants from Moldova (96.5%, a difference of 0.010%), Immigrants from Norway (96.5%, a difference of 0.010%), Pueblo (96.5%, a difference of 0.050%), Immigrants from Zimbabwe (96.5%, a difference of 0.050%), and Choctaw (96.5%, a difference of 0.050%). Similarly, the demographic groups most similar to German Russians are Menominee (96.7%, a difference of 0.0%), Thai (96.7%, a difference of 0.0%), Immigrants from Czechoslovakia (96.6%, a difference of 0.030%), Immigrants from Singapore (96.6%, a difference of 0.030%), and Shoshone (96.6%, a difference of 0.050%).
| Demographics | Rating | Rank | 7th Grade |
| Menominee | 98.7 /100 | #99 | Exceptional 96.7% |
| German Russians | 98.6 /100 | #100 | Exceptional 96.7% |
| Thais | 98.6 /100 | #101 | Exceptional 96.7% |
| Immigrants | Czechoslovakia | 98.3 /100 | #102 | Exceptional 96.6% |
| Immigrants | Singapore | 98.3 /100 | #103 | Exceptional 96.6% |
| Shoshone | 98.1 /100 | #104 | Exceptional 96.6% |
| South Africans | 98.0 /100 | #105 | Exceptional 96.6% |
| Iroquois | 97.9 /100 | #106 | Exceptional 96.6% |
| Lumbee | 97.8 /100 | #107 | Exceptional 96.6% |
| Immigrants | Saudi Arabia | 97.8 /100 | #108 | Exceptional 96.6% |
| Bhutanese | 97.7 /100 | #109 | Exceptional 96.6% |
| Okinawans | 97.4 /100 | #110 | Exceptional 96.6% |
| Immigrants | Latvia | 97.4 /100 | #111 | Exceptional 96.6% |
| Immigrants | Nonimmigrants | 97.0 /100 | #112 | Exceptional 96.5% |
| Pueblo | 96.8 /100 | #113 | Exceptional 96.5% |
| Immigrants | Zimbabwe | 96.6 /100 | #114 | Exceptional 96.5% |
| Choctaw | 96.6 /100 | #115 | Exceptional 96.5% |
| Syrians | 96.6 /100 | #116 | Exceptional 96.5% |
| Immigrants | Moldova | 95.7 /100 | #117 | Exceptional 96.5% |
| Immigrants | Japan | 95.5 /100 | #118 | Exceptional 96.5% |
| Immigrants | Norway | 95.2 /100 | #119 | Exceptional 96.5% |