Immigrants from Jamaica vs Immigrants from Denmark Professional Degree

COMPARE

Immigrants from Jamaica
Race
Ancestry
AfghanAfricanAlaska NativeAlaskan AthabascanAlbanianAleutAlsatianAmericanApacheArabArapahoArgentineanArmenianAssyrian/Chaldean/SyriacAustralianAustrianBahamianBangladeshiBarbadianBasqueBelgianBelizeanBermudanBhutaneseBlackfeetBolivianBrazilianBritishBritish West IndianBulgarianBurmeseCajunCambodianCanadianCape VerdeanCarpatho RusynCelticCentral AmericanCentral American IndianCherokeeCheyenneChickasawChileanChineseChippewaChoctawColombianColvilleComancheCosta RicanCreeCreekCroatianCrowCubanCypriotCzechCzechoslovakianDanishDelawareDominicanDutchDutch West IndianEastern EuropeanEcuadorianEgyptianEnglishEstonianEthiopianEuropeanFijianFilipinoFinnishFrenchFrench American IndianFrench CanadianGermanGerman RussianGhanaianGreekGuamanian/ChamorroGuatemalanGuyaneseHaitianHmongHonduranHopiHoumaHungarianIcelanderIndian (Asian)IndonesianInupiatIranianIraqiIrishIroquoisIsraeliItalianJamaicanJapaneseJordanianKenyanKiowaKoreanLaotianLatvianLebaneseLiberianLithuanianLumbeeLuxembourgerMacedonianMalaysianMalteseMarshalleseMenomineeMexicanMexican American IndianMongolianMoroccanNative HawaiianNavajoNepaleseNew ZealanderNicaraguanNigerianNorthern EuropeanNorwegianOkinawanOsageOttawaPaiutePakistaniPalestinianPanamanianParaguayanPennsylvania GermanPeruvianPimaPolishPortuguesePotawatomiPuebloPuerto RicanPuget Sound SalishRomanianRussianSalvadoranSamoanScandinavianScotch-IrishScottishSeminoleSenegaleseSerbianShoshoneSierra LeoneanSiouxSlavicSlovakSloveneSomaliSouth AfricanSouth AmericanSouth American IndianSoviet UnionSpaniardSpanishSpanish AmericanSpanish American IndianSri LankanSubsaharan AfricanSudaneseSwedishSwissSyrianTaiwaneseThaiTlingit-HaidaTohono O'OdhamTonganTrinidadian and TobagonianTsimshianTurkishU.S. Virgin IslanderUgandanUkrainianUruguayanUteVenezuelanVietnameseWelshWest IndianYakamaYaquiYugoslavianYumanYup'ikZimbabwean
Immigration
NonimmigrantsImmigrantsAfghanistanAfricaAlbaniaArgentinaArmeniaAsiaAustraliaAustriaBahamasBangladeshBarbadosBelarusBelgiumBelizeBoliviaBosnia and HerzegovinaBrazilBulgariaBurma/MyanmarCabo VerdeCambodiaCameroonCanadaCaribbeanCentral AmericaChileChinaColombiaCongoCosta RicaCroatiaCubaCzechoslovakiaDominicaDominican RepublicEastern AfricaEastern AsiaEastern EuropeEcuadorEgyptEl SalvadorEnglandEritreaEthiopiaEuropeFijiFranceGermanyGhanaGreeceGrenadaGuatemalaGuyanaHaitiHondurasHong KongHungaryIndiaIndonesiaIranIraqIrelandIsraelItalyJamaicaJapanJordanKazakhstanKenyaKoreaKuwaitLaosLatin AmericaLatviaLebanonLiberiaLithuaniaMalaysiaMexicoMicronesiaMiddle AfricaMoldovaMoroccoNepalNetherlandsNicaraguaNigeriaNorth AmericaNorth MacedoniaNorthern AfricaNorthern EuropeNorwayOceaniaPakistanPanamaPeruPhilippinesPolandPortugalRomaniaRussiaSaudi ArabiaScotlandSenegalSerbiaSierra LeoneSingaporeSomaliaSouth AfricaSouth AmericaSouth Central AsiaSouth Eastern AsiaSouthern EuropeSpainSri LankaSt. Vincent and the GrenadinesSudanSwedenSwitzerlandSyriaTaiwanThailandTrinidad and TobagoTurkeyUgandaUkraineUruguayUzbekistanVenezuelaVietnamWest IndiesWestern AfricaWestern AsiaWestern EuropeYemenZaireZimbabweAzores
Immigrants from Denmark
Race
Ancestry
AfghanAfricanAlaska NativeAlaskan AthabascanAlbanianAleutAlsatianAmericanApacheArabArapahoArgentineanArmenianAssyrian/Chaldean/SyriacAustralianAustrianBahamianBangladeshiBarbadianBasqueBelgianBelizeanBermudanBhutaneseBlackfeetBolivianBrazilianBritishBritish West IndianBulgarianBurmeseCajunCambodianCanadianCape VerdeanCarpatho RusynCelticCentral AmericanCentral American IndianCherokeeCheyenneChickasawChileanChineseChippewaChoctawColombianColvilleComancheCosta RicanCreeCreekCroatianCrowCubanCypriotCzechCzechoslovakianDanishDelawareDominicanDutchDutch West IndianEastern EuropeanEcuadorianEgyptianEnglishEstonianEthiopianEuropeanFijianFilipinoFinnishFrenchFrench American IndianFrench CanadianGermanGerman RussianGhanaianGreekGuamanian/ChamorroGuatemalanGuyaneseHaitianHmongHonduranHopiHoumaHungarianIcelanderIndian (Asian)IndonesianInupiatIranianIraqiIrishIroquoisIsraeliItalianJamaicanJapaneseJordanianKenyanKiowaKoreanLaotianLatvianLebaneseLiberianLithuanianLumbeeLuxembourgerMacedonianMalaysianMalteseMarshalleseMenomineeMexicanMexican American IndianMongolianMoroccanNative HawaiianNavajoNepaleseNew ZealanderNicaraguanNigerianNorthern EuropeanNorwegianOkinawanOsageOttawaPaiutePakistaniPalestinianPanamanianParaguayanPennsylvania GermanPeruvianPimaPolishPortuguesePotawatomiPuebloPuerto RicanPuget Sound SalishRomanianRussianSalvadoranSamoanScandinavianScotch-IrishScottishSeminoleSenegaleseSerbianShoshoneSierra LeoneanSiouxSlavicSlovakSloveneSomaliSouth AfricanSouth AmericanSouth American IndianSoviet UnionSpaniardSpanishSpanish AmericanSpanish American IndianSri LankanSubsaharan AfricanSudaneseSwedishSwissSyrianTaiwaneseThaiTlingit-HaidaTohono O'OdhamTonganTrinidadian and TobagonianTsimshianTurkishU.S. Virgin IslanderUgandanUkrainianUruguayanUteVenezuelanVietnameseWelshWest IndianYakamaYaquiYugoslavianYumanYup'ikZimbabwean
Immigration
NonimmigrantsImmigrantsAfghanistanAfricaAlbaniaArgentinaArmeniaAsiaAustraliaAustriaBahamasBangladeshBarbadosBelarusBelgiumBelizeBoliviaBosnia and HerzegovinaBrazilBulgariaBurma/MyanmarCabo VerdeCambodiaCameroonCanadaCaribbeanCentral AmericaChileChinaColombiaCongoCosta RicaCroatiaCubaCzechoslovakiaDenmarkDominicaDominican RepublicEastern AfricaEastern AsiaEastern EuropeEcuadorEgyptEl SalvadorEnglandEritreaEthiopiaEuropeFijiFranceGermanyGhanaGreeceGrenadaGuatemalaGuyanaHaitiHondurasHong KongHungaryIndiaIndonesiaIranIraqIrelandIsraelItalyJapanJordanKazakhstanKenyaKoreaKuwaitLaosLatin AmericaLatviaLebanonLiberiaLithuaniaMalaysiaMexicoMicronesiaMiddle AfricaMoldovaMoroccoNepalNetherlandsNicaraguaNigeriaNorth AmericaNorth MacedoniaNorthern AfricaNorthern EuropeNorwayOceaniaPakistanPanamaPeruPhilippinesPolandPortugalRomaniaRussiaSaudi ArabiaScotlandSenegalSerbiaSierra LeoneSingaporeSomaliaSouth AfricaSouth AmericaSouth Central AsiaSouth Eastern AsiaSouthern EuropeSpainSri LankaSt. Vincent and the GrenadinesSudanSwedenSwitzerlandSyriaTaiwanThailandTrinidad and TobagoTurkeyUgandaUkraineUruguayUzbekistanVenezuelaVietnamWest IndiesWestern AfricaWestern AsiaWestern EuropeYemenZaireZimbabweAzores
Professional Degree
Income
Poverty
Unemployment
Labor Participation
Family Structure
Vehicle Availability
Education Level
Disability

Professional Degree Comparison

Immigrants from Jamaica

Immigrants from Denmark

Tragic
Exceptional
3.6%
PROFESSIONAL DEGREE
0.5/ 100
METRIC RATING
272nd/ 347
METRIC RANK
6.4%
PROFESSIONAL DEGREE
100.0/ 100
METRIC RATING
20th/ 347
METRIC RANK

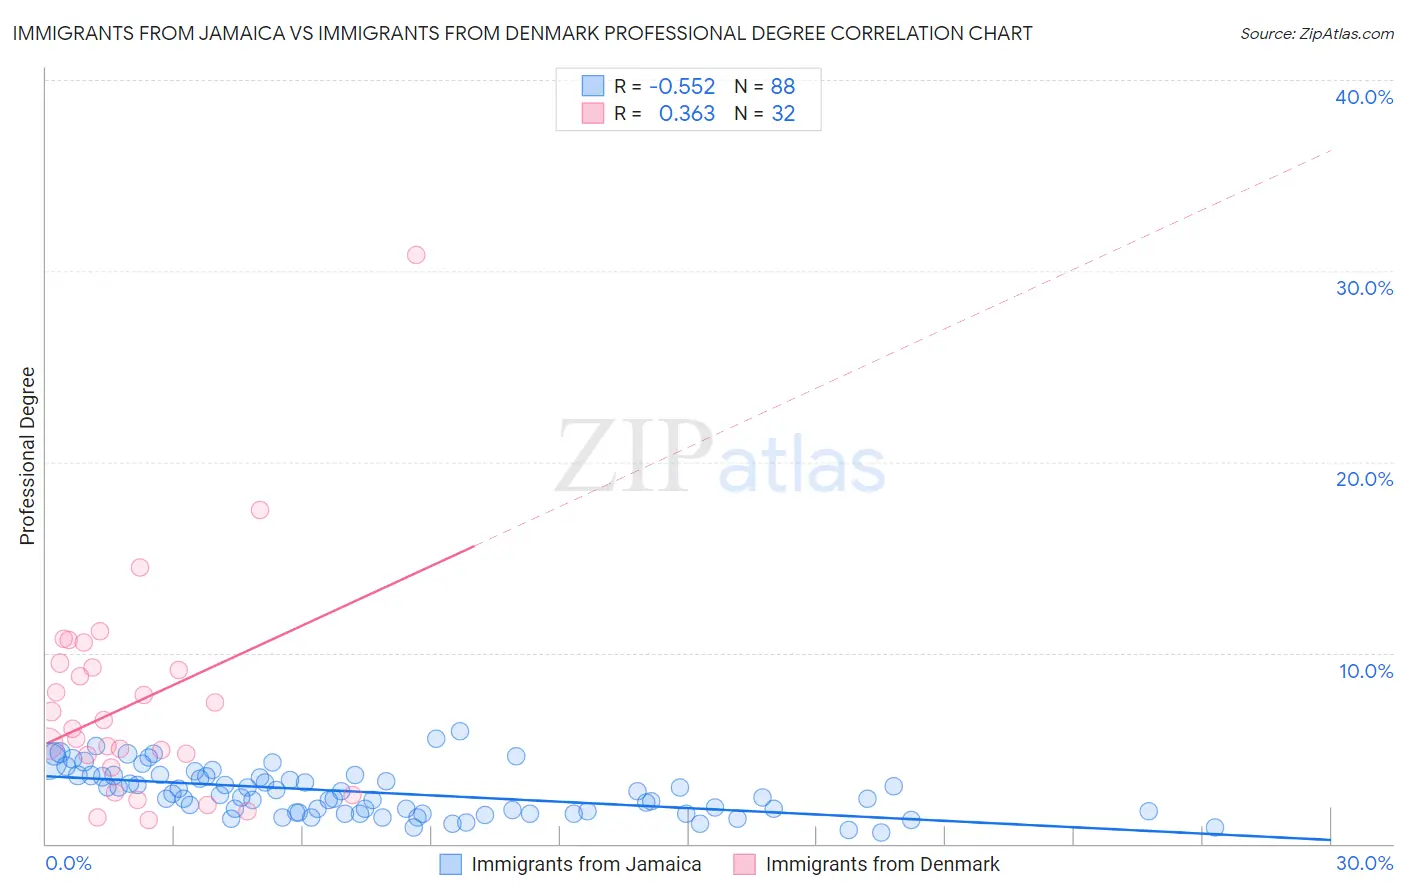
Immigrants from Jamaica vs Immigrants from Denmark Professional Degree Correlation Chart

The statistical analysis conducted on geographies consisting of 301,293,003 people shows a substantial negative correlation between the proportion of Immigrants from Jamaica and percentage of population with at least professional degree education in the United States with a correlation coefficient (R) of -0.552 and weighted average of 3.6%. Similarly, the statistical analysis conducted on geographies consisting of 136,370,124 people shows a mild positive correlation between the proportion of Immigrants from Denmark and percentage of population with at least professional degree education in the United States with a correlation coefficient (R) of 0.363 and weighted average of 6.4%, a difference of 80.1%.
Immigrants from Jamaica vs Immigrants from Denmark Professional Degree

Professional Degree Correlation Summary

MeasurementImmigrants from JamaicaImmigrants from Denmark
Minimum0.59%1.2%
Maximum5.9%30.8%
Range5.3%29.6%
Mean2.7%7.4%
Median2.5%6.3%
Interquartile 25% (IQ1)1.6%4.3%
Interquartile 75% (IQ3)3.6%9.3%
Interquartile Range (IQR)2.0%5.0%
Standard Deviation (Sample)1.2%5.7%
Standard Deviation (Population)1.2%5.7%

Similar Demographics by Professional Degree

Demographics Similar to Immigrants from Jamaica by Professional Degree

In terms of professional degree, the demographic groups most similar to Immigrants from Jamaica are Belizean (3.6%, a difference of 0.030%), American (3.6%, a difference of 0.060%), Potawatomi (3.6%, a difference of 0.19%), Immigrants from Dominica (3.6%, a difference of 0.42%), and Liberian (3.6%, a difference of 0.46%).
DemographicsRating | RankProfessional Degree
Immigrants | Congo
0.8
/100
|
#265
Tragic
3.6%
Central American Indians
0.8
/100
|
#266
Tragic
3.6%
Delaware
0.7
/100
|
#267
Tragic
3.6%
Aleuts
0.7
/100
|
#268
Tragic
3.6%
Immigrants | Cuba
0.6
/100
|
#269
Tragic
3.6%
Central Americans
0.6
/100
|
#270
Tragic
3.6%
Belizeans
0.5
/100
|
#271
Tragic
3.6%
Immigrants | Jamaica
0.5
/100
|
#272
Tragic
3.6%
Americans
0.5
/100
|
#273
Tragic
3.6%
Potawatomi
0.5
/100
|
#274
Tragic
3.6%
Immigrants | Dominica
0.5
/100
|
#275
Tragic
3.6%
Liberians
0.5
/100
|
#276
Tragic
3.6%
Cheyenne
0.5
/100
|
#277
Tragic
3.6%
Japanese
0.5
/100
|
#278
Tragic
3.5%
Immigrants | Portugal
0.5
/100
|
#279
Tragic
3.5%

Demographics Similar to Immigrants from Denmark by Professional Degree

In terms of professional degree, the demographic groups most similar to Immigrants from Denmark are Immigrants from Hong Kong (6.4%, a difference of 0.22%), Immigrants from Japan (6.4%, a difference of 0.95%), Russian (6.3%, a difference of 1.4%), Immigrants from Spain (6.3%, a difference of 1.5%), and Indian (Asian) (6.5%, a difference of 1.5%).
DemographicsRating | RankProfessional Degree
Immigrants | Australia
100.0
/100
|
#13
Exceptional
6.9%
Immigrants | France
100.0
/100
|
#14
Exceptional
6.8%
Immigrants | China
100.0
/100
|
#15
Exceptional
6.7%
Immigrants | Sweden
100.0
/100
|
#16
Exceptional
6.7%
Immigrants | Eastern Asia
100.0
/100
|
#17
Exceptional
6.6%
Soviet Union
100.0
/100
|
#18
Exceptional
6.6%
Indians (Asian)
100.0
/100
|
#19
Exceptional
6.5%
Immigrants | Denmark
100.0
/100
|
#20
Exceptional
6.4%
Immigrants | Hong Kong
100.0
/100
|
#21
Exceptional
6.4%
Immigrants | Japan
100.0
/100
|
#22
Exceptional
6.4%
Russians
100.0
/100
|
#23
Exceptional
6.3%
Immigrants | Spain
100.0
/100
|
#24
Exceptional
6.3%
Immigrants | Ireland
100.0
/100
|
#25
Exceptional
6.3%
Latvians
100.0
/100
|
#26
Exceptional
6.2%
Immigrants | Northern Europe
100.0
/100
|
#27
Exceptional
6.2%