Immigrants from Jamaica vs Filipino Professional Degree
COMPARE
Immigrants from Jamaica
Filipino
Professional Degree
Professional Degree Comparison
Immigrants from Jamaica
Filipinos
3.6%
PROFESSIONAL DEGREE
0.5/ 100
METRIC RATING
272nd/ 347
METRIC RANK
7.6%
PROFESSIONAL DEGREE
100.0/ 100
METRIC RATING
4th/ 347
METRIC RANK
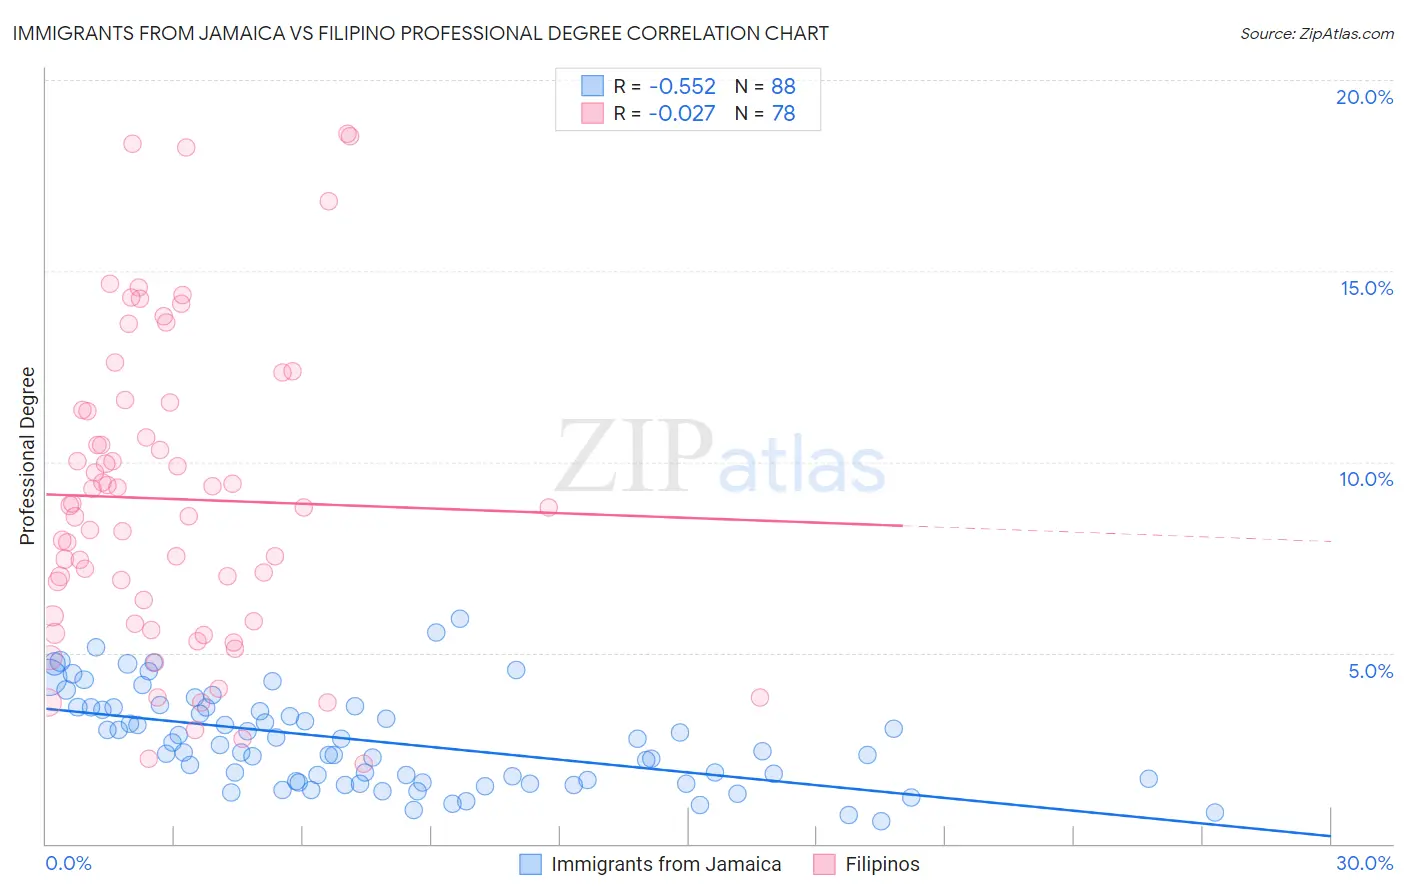
Immigrants from Jamaica vs Filipino Professional Degree Correlation Chart
The statistical analysis conducted on geographies consisting of 301,293,003 people shows a substantial negative correlation between the proportion of Immigrants from Jamaica and percentage of population with at least professional degree education in the United States with a correlation coefficient (R) of -0.552 and weighted average of 3.6%. Similarly, the statistical analysis conducted on geographies consisting of 254,169,357 people shows no correlation between the proportion of Filipinos and percentage of population with at least professional degree education in the United States with a correlation coefficient (R) of -0.027 and weighted average of 7.6%, a difference of 112.0%.
Professional Degree Correlation Summary
| Measurement | Immigrants from Jamaica | Filipino |
| Minimum | 0.59% | 2.1% |
| Maximum | 5.9% | 18.6% |
| Range | 5.3% | 16.5% |
| Mean | 2.7% | 9.0% |
| Median | 2.5% | 8.8% |
| Interquartile 25% (IQ1) | 1.6% | 5.8% |
| Interquartile 75% (IQ3) | 3.6% | 11.4% |
| Interquartile Range (IQR) | 2.0% | 5.5% |
| Standard Deviation (Sample) | 1.2% | 4.0% |
| Standard Deviation (Population) | 1.2% | 4.0% |
Similar Demographics by Professional Degree
Demographics Similar to Immigrants from Jamaica by Professional Degree
In terms of professional degree, the demographic groups most similar to Immigrants from Jamaica are Belizean (3.6%, a difference of 0.030%), American (3.6%, a difference of 0.060%), Potawatomi (3.6%, a difference of 0.19%), Immigrants from Dominica (3.6%, a difference of 0.42%), and Liberian (3.6%, a difference of 0.46%).
| Demographics | Rating | Rank | Professional Degree |
| Immigrants | Congo | 0.8 /100 | #265 | Tragic 3.6% |
| Central American Indians | 0.8 /100 | #266 | Tragic 3.6% |
| Delaware | 0.7 /100 | #267 | Tragic 3.6% |
| Aleuts | 0.7 /100 | #268 | Tragic 3.6% |
| Immigrants | Cuba | 0.6 /100 | #269 | Tragic 3.6% |
| Central Americans | 0.6 /100 | #270 | Tragic 3.6% |
| Belizeans | 0.5 /100 | #271 | Tragic 3.6% |
| Immigrants | Jamaica | 0.5 /100 | #272 | Tragic 3.6% |
| Americans | 0.5 /100 | #273 | Tragic 3.6% |
| Potawatomi | 0.5 /100 | #274 | Tragic 3.6% |
| Immigrants | Dominica | 0.5 /100 | #275 | Tragic 3.6% |
| Liberians | 0.5 /100 | #276 | Tragic 3.6% |
| Cheyenne | 0.5 /100 | #277 | Tragic 3.6% |
| Japanese | 0.5 /100 | #278 | Tragic 3.5% |
| Immigrants | Portugal | 0.5 /100 | #279 | Tragic 3.5% |
Demographics Similar to Filipinos by Professional Degree
In terms of professional degree, the demographic groups most similar to Filipinos are Iranian (7.6%, a difference of 0.77%), Immigrants from Singapore (7.7%, a difference of 2.4%), Immigrants from Iran (7.3%, a difference of 3.2%), Okinawan (7.3%, a difference of 3.4%), and Immigrants from Israel (7.9%, a difference of 3.9%).
| Demographics | Rating | Rank | Professional Degree |
| Immigrants | Israel | 100.0 /100 | #1 | Exceptional 7.9% |
| Immigrants | Singapore | 100.0 /100 | #2 | Exceptional 7.7% |
| Iranians | 100.0 /100 | #3 | Exceptional 7.6% |
| Filipinos | 100.0 /100 | #4 | Exceptional 7.6% |
| Immigrants | Iran | 100.0 /100 | #5 | Exceptional 7.3% |
| Okinawans | 100.0 /100 | #6 | Exceptional 7.3% |
| Eastern Europeans | 100.0 /100 | #7 | Exceptional 7.1% |
| Immigrants | Switzerland | 100.0 /100 | #8 | Exceptional 7.1% |
| Immigrants | Taiwan | 100.0 /100 | #9 | Exceptional 7.1% |
| Immigrants | Belgium | 100.0 /100 | #10 | Exceptional 7.0% |
| Cypriots | 100.0 /100 | #11 | Exceptional 6.9% |
| Israelis | 100.0 /100 | #12 | Exceptional 6.9% |
| Immigrants | Australia | 100.0 /100 | #13 | Exceptional 6.9% |
| Immigrants | France | 100.0 /100 | #14 | Exceptional 6.8% |
| Immigrants | China | 100.0 /100 | #15 | Exceptional 6.7% |