Immigrants from Italy vs Immigrants from Nicaragua Associate's Degree
COMPARE
Immigrants from Italy
Immigrants from Nicaragua
Associate's Degree
Associate's Degree Comparison
Immigrants from Italy
Immigrants from Nicaragua
49.3%
ASSOCIATE'S DEGREE
96.7/ 100
METRIC RATING
106th/ 347
METRIC RANK
40.3%
ASSOCIATE'S DEGREE
0.1/ 100
METRIC RATING
279th/ 347
METRIC RANK
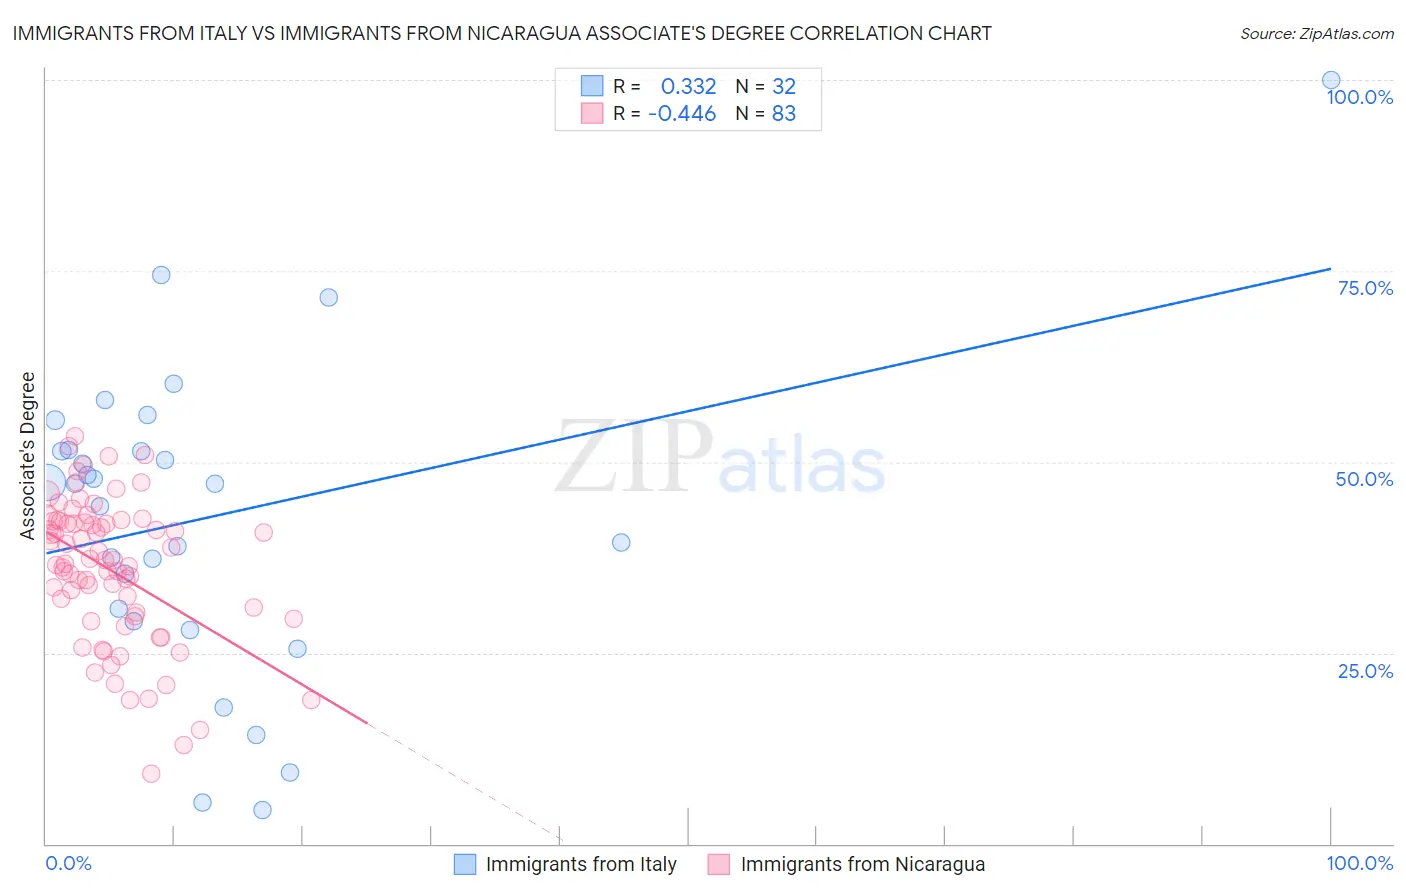
Immigrants from Italy vs Immigrants from Nicaragua Associate's Degree Correlation Chart
The statistical analysis conducted on geographies consisting of 324,223,165 people shows a mild positive correlation between the proportion of Immigrants from Italy and percentage of population with at least associate's degree education in the United States with a correlation coefficient (R) of 0.332 and weighted average of 49.3%. Similarly, the statistical analysis conducted on geographies consisting of 236,338,316 people shows a moderate negative correlation between the proportion of Immigrants from Nicaragua and percentage of population with at least associate's degree education in the United States with a correlation coefficient (R) of -0.446 and weighted average of 40.3%, a difference of 22.4%.
Associate's Degree Correlation Summary
| Measurement | Immigrants from Italy | Immigrants from Nicaragua |
| Minimum | 4.5% | 9.1% |
| Maximum | 100.0% | 53.3% |
| Range | 95.5% | 44.2% |
| Mean | 42.7% | 35.9% |
| Median | 47.1% | 37.1% |
| Interquartile 25% (IQ1) | 30.0% | 29.7% |
| Interquartile 75% (IQ3) | 51.5% | 42.2% |
| Interquartile Range (IQR) | 21.5% | 12.4% |
| Standard Deviation (Sample) | 20.4% | 9.4% |
| Standard Deviation (Population) | 20.0% | 9.3% |
Similar Demographics by Associate's Degree
Demographics Similar to Immigrants from Italy by Associate's Degree
In terms of associate's degree, the demographic groups most similar to Immigrants from Italy are Croatian (49.3%, a difference of 0.0%), Syrian (49.3%, a difference of 0.030%), Jordanian (49.2%, a difference of 0.090%), Venezuelan (49.4%, a difference of 0.15%), and Ukrainian (49.4%, a difference of 0.21%).
| Demographics | Rating | Rank | Associate's Degree |
| Macedonians | 97.8 /100 | #99 | Exceptional 49.6% |
| Immigrants | Nepal | 97.5 /100 | #100 | Exceptional 49.5% |
| Northern Europeans | 97.3 /100 | #101 | Exceptional 49.5% |
| Chileans | 97.3 /100 | #102 | Exceptional 49.4% |
| Ukrainians | 97.1 /100 | #103 | Exceptional 49.4% |
| Venezuelans | 97.0 /100 | #104 | Exceptional 49.4% |
| Croatians | 96.8 /100 | #105 | Exceptional 49.3% |
| Immigrants | Italy | 96.7 /100 | #106 | Exceptional 49.3% |
| Syrians | 96.7 /100 | #107 | Exceptional 49.3% |
| Jordanians | 96.6 /100 | #108 | Exceptional 49.2% |
| Immigrants | Morocco | 96.3 /100 | #109 | Exceptional 49.2% |
| Austrians | 95.8 /100 | #110 | Exceptional 49.1% |
| Immigrants | Venezuela | 95.8 /100 | #111 | Exceptional 49.1% |
| Immigrants | Chile | 95.3 /100 | #112 | Exceptional 49.0% |
| Palestinians | 95.3 /100 | #113 | Exceptional 49.0% |
Demographics Similar to Immigrants from Nicaragua by Associate's Degree
In terms of associate's degree, the demographic groups most similar to Immigrants from Nicaragua are Ottawa (40.3%, a difference of 0.040%), Blackfeet (40.3%, a difference of 0.19%), Immigrants from Micronesia (40.2%, a difference of 0.20%), Puerto Rican (40.4%, a difference of 0.24%), and Immigrants from Portugal (40.1%, a difference of 0.30%).
| Demographics | Rating | Rank | Associate's Degree |
| Belizeans | 0.1 /100 | #272 | Tragic 40.6% |
| Puget Sound Salish | 0.1 /100 | #273 | Tragic 40.5% |
| Immigrants | Dominica | 0.1 /100 | #274 | Tragic 40.5% |
| Potawatomi | 0.1 /100 | #275 | Tragic 40.4% |
| Puerto Ricans | 0.1 /100 | #276 | Tragic 40.4% |
| Blackfeet | 0.1 /100 | #277 | Tragic 40.3% |
| Ottawa | 0.1 /100 | #278 | Tragic 40.3% |
| Immigrants | Nicaragua | 0.1 /100 | #279 | Tragic 40.3% |
| Immigrants | Micronesia | 0.1 /100 | #280 | Tragic 40.2% |
| Immigrants | Portugal | 0.1 /100 | #281 | Tragic 40.1% |
| Bangladeshis | 0.1 /100 | #282 | Tragic 40.0% |
| Haitians | 0.1 /100 | #283 | Tragic 40.0% |
| Comanche | 0.1 /100 | #284 | Tragic 39.9% |
| Immigrants | Belize | 0.1 /100 | #285 | Tragic 39.9% |
| Immigrants | Caribbean | 0.0 /100 | #286 | Tragic 39.7% |