Immigrants from Italy vs Immigrants from Croatia Associate's Degree
COMPARE
Immigrants from Italy
Immigrants from Croatia
Associate's Degree
Associate's Degree Comparison
Immigrants from Italy
Immigrants from Croatia
49.3%
ASSOCIATE'S DEGREE
96.7/ 100
METRIC RATING
106th/ 347
METRIC RANK
50.2%
ASSOCIATE'S DEGREE
98.9/ 100
METRIC RATING
86th/ 347
METRIC RANK
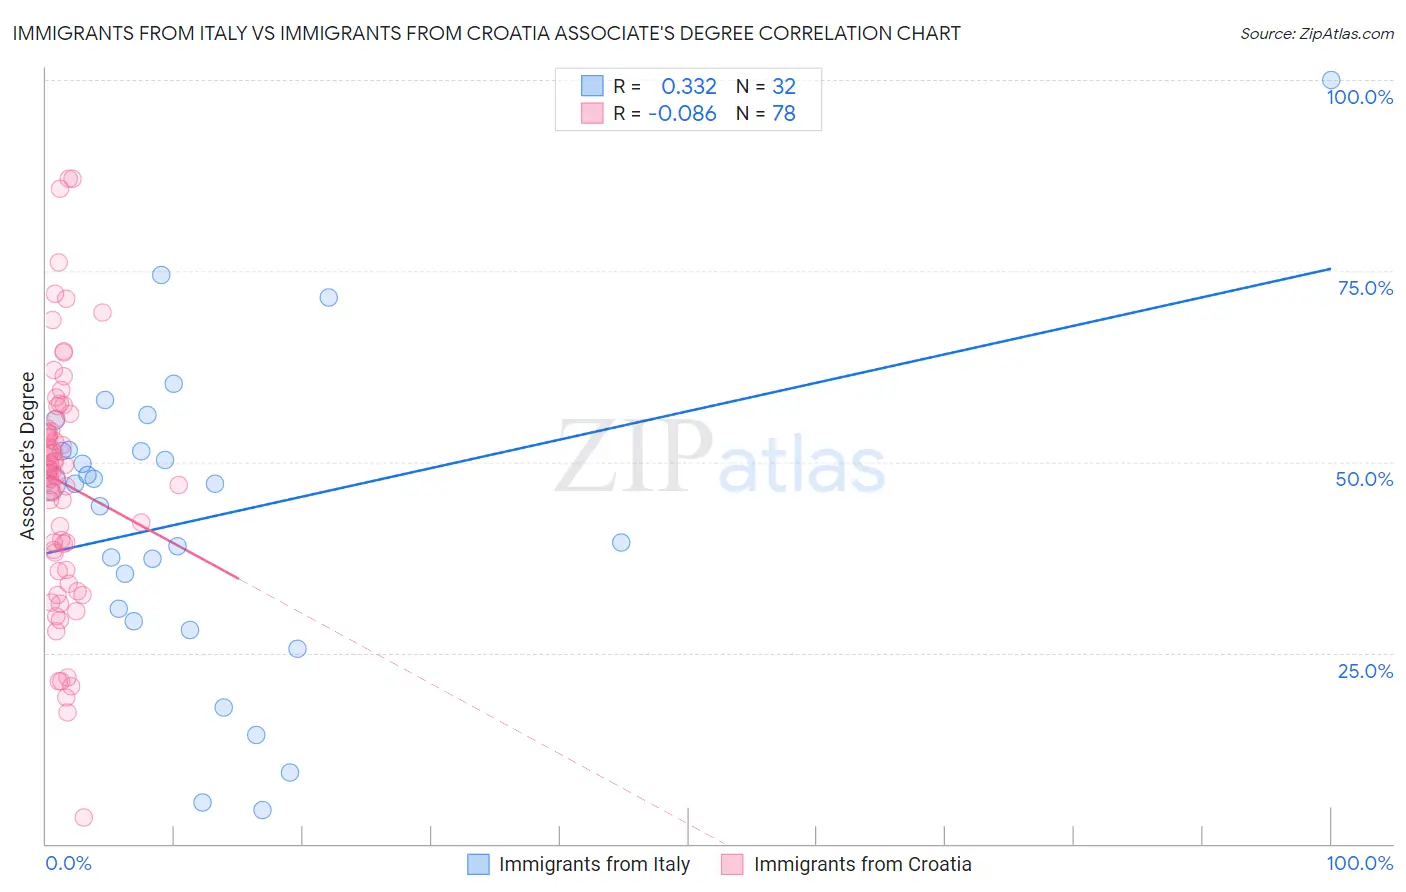
Immigrants from Italy vs Immigrants from Croatia Associate's Degree Correlation Chart
The statistical analysis conducted on geographies consisting of 324,223,165 people shows a mild positive correlation between the proportion of Immigrants from Italy and percentage of population with at least associate's degree education in the United States with a correlation coefficient (R) of 0.332 and weighted average of 49.3%. Similarly, the statistical analysis conducted on geographies consisting of 132,578,161 people shows a slight negative correlation between the proportion of Immigrants from Croatia and percentage of population with at least associate's degree education in the United States with a correlation coefficient (R) of -0.086 and weighted average of 50.2%, a difference of 1.9%.
Associate's Degree Correlation Summary
| Measurement | Immigrants from Italy | Immigrants from Croatia |
| Minimum | 4.5% | 3.4% |
| Maximum | 100.0% | 87.1% |
| Range | 95.5% | 83.7% |
| Mean | 42.7% | 47.3% |
| Median | 47.1% | 48.7% |
| Interquartile 25% (IQ1) | 30.0% | 38.1% |
| Interquartile 75% (IQ3) | 51.5% | 54.3% |
| Interquartile Range (IQR) | 21.5% | 16.2% |
| Standard Deviation (Sample) | 20.4% | 15.9% |
| Standard Deviation (Population) | 20.0% | 15.8% |
Demographics Similar to Immigrants from Italy and Immigrants from Croatia by Associate's Degree
In terms of associate's degree, the demographic groups most similar to Immigrants from Italy are Croatian (49.3%, a difference of 0.0%), Venezuelan (49.4%, a difference of 0.15%), Ukrainian (49.4%, a difference of 0.21%), Chilean (49.4%, a difference of 0.32%), and Northern European (49.5%, a difference of 0.35%). Similarly, the demographic groups most similar to Immigrants from Croatia are Immigrants from Moldova (50.2%, a difference of 0.12%), Immigrants from Canada (50.1%, a difference of 0.19%), Immigrants from Western Europe (50.1%, a difference of 0.19%), Immigrants from Ethiopia (50.1%, a difference of 0.20%), and Immigrants from Western Asia (50.1%, a difference of 0.28%).
| Demographics | Rating | Rank | Associate's Degree |
| Immigrants | Croatia | 98.9 /100 | #86 | Exceptional 50.2% |
| Immigrants | Moldova | 98.8 /100 | #87 | Exceptional 50.2% |
| Immigrants | Canada | 98.7 /100 | #88 | Exceptional 50.1% |
| Immigrants | Western Europe | 98.7 /100 | #89 | Exceptional 50.1% |
| Immigrants | Ethiopia | 98.7 /100 | #90 | Exceptional 50.1% |
| Immigrants | Western Asia | 98.7 /100 | #91 | Exceptional 50.1% |
| Immigrants | North America | 98.7 /100 | #92 | Exceptional 50.1% |
| Immigrants | Brazil | 98.5 /100 | #93 | Exceptional 50.0% |
| Laotians | 98.4 /100 | #94 | Exceptional 49.9% |
| Immigrants | England | 98.0 /100 | #95 | Exceptional 49.7% |
| Romanians | 98.0 /100 | #96 | Exceptional 49.7% |
| Immigrants | Ukraine | 98.0 /100 | #97 | Exceptional 49.7% |
| Immigrants | Northern Africa | 97.9 /100 | #98 | Exceptional 49.7% |
| Macedonians | 97.8 /100 | #99 | Exceptional 49.6% |
| Immigrants | Nepal | 97.5 /100 | #100 | Exceptional 49.5% |
| Northern Europeans | 97.3 /100 | #101 | Exceptional 49.5% |
| Chileans | 97.3 /100 | #102 | Exceptional 49.4% |
| Ukrainians | 97.1 /100 | #103 | Exceptional 49.4% |
| Venezuelans | 97.0 /100 | #104 | Exceptional 49.4% |
| Croatians | 96.8 /100 | #105 | Exceptional 49.3% |
| Immigrants | Italy | 96.7 /100 | #106 | Exceptional 49.3% |