Immigrants from Italy vs Immigrants from Cameroon High School Diploma

COMPARE

Immigrants from Italy
Race
Ancestry
AfghanAfricanAlaska NativeAlaskan AthabascanAlbanianAleutAlsatianAmericanApacheArabArapahoArgentineanArmenianAssyrian/Chaldean/SyriacAustralianAustrianBahamianBangladeshiBarbadianBasqueBelgianBelizeanBermudanBhutaneseBlackfeetBolivianBrazilianBritishBritish West IndianBulgarianBurmeseCajunCambodianCanadianCape VerdeanCarpatho RusynCelticCentral AmericanCentral American IndianCherokeeCheyenneChickasawChileanChineseChippewaChoctawColombianColvilleComancheCosta RicanCreeCreekCroatianCrowCubanCypriotCzechCzechoslovakianDanishDelawareDominicanDutchDutch West IndianEastern EuropeanEcuadorianEgyptianEnglishEstonianEthiopianEuropeanFijianFilipinoFinnishFrenchFrench American IndianFrench CanadianGermanGerman RussianGhanaianGreekGuamanian/ChamorroGuatemalanGuyaneseHaitianHmongHonduranHopiHoumaHungarianIcelanderIndian (Asian)IndonesianInupiatIranianIraqiIrishIroquoisIsraeliItalianJamaicanJapaneseJordanianKenyanKiowaKoreanLaotianLatvianLebaneseLiberianLithuanianLumbeeLuxembourgerMacedonianMalaysianMalteseMarshalleseMenomineeMexicanMexican American IndianMongolianMoroccanNative HawaiianNavajoNepaleseNew ZealanderNicaraguanNigerianNorthern EuropeanNorwegianOkinawanOsageOttawaPaiutePakistaniPalestinianPanamanianParaguayanPennsylvania GermanPeruvianPimaPolishPortuguesePotawatomiPuebloPuerto RicanPuget Sound SalishRomanianRussianSalvadoranSamoanScandinavianScotch-IrishScottishSeminoleSenegaleseSerbianShoshoneSierra LeoneanSiouxSlavicSlovakSloveneSomaliSouth AfricanSouth AmericanSouth American IndianSoviet UnionSpaniardSpanishSpanish AmericanSpanish American IndianSri LankanSubsaharan AfricanSudaneseSwedishSwissSyrianTaiwaneseThaiTlingit-HaidaTohono O'OdhamTonganTrinidadian and TobagonianTsimshianTurkishU.S. Virgin IslanderUgandanUkrainianUruguayanUteVenezuelanVietnameseWelshWest IndianYakamaYaquiYugoslavianYumanYup'ikZimbabwean
Immigration
NonimmigrantsImmigrantsAfghanistanAfricaAlbaniaArgentinaArmeniaAsiaAustraliaAustriaBahamasBangladeshBarbadosBelarusBelgiumBelizeBoliviaBosnia and HerzegovinaBrazilBulgariaBurma/MyanmarCabo VerdeCambodiaCanadaCaribbeanCentral AmericaChileChinaColombiaCongoCosta RicaCroatiaCubaCzechoslovakiaDenmarkDominicaDominican RepublicEastern AfricaEastern AsiaEastern EuropeEcuadorEgyptEl SalvadorEnglandEritreaEthiopiaEuropeFijiFranceGermanyGhanaGreeceGrenadaGuatemalaGuyanaHaitiHondurasHong KongHungaryIndiaIndonesiaIranIraqIrelandIsraelItalyJamaicaJapanJordanKazakhstanKenyaKoreaKuwaitLaosLatin AmericaLatviaLebanonLiberiaLithuaniaMalaysiaMexicoMicronesiaMiddle AfricaMoldovaMoroccoNepalNetherlandsNicaraguaNigeriaNorth AmericaNorth MacedoniaNorthern AfricaNorthern EuropeNorwayOceaniaPakistanPanamaPeruPhilippinesPolandPortugalRomaniaRussiaSaudi ArabiaScotlandSenegalSerbiaSierra LeoneSingaporeSomaliaSouth AfricaSouth AmericaSouth Central AsiaSouth Eastern AsiaSouthern EuropeSpainSri LankaSt. Vincent and the GrenadinesSudanSwedenSwitzerlandSyriaTaiwanThailandTrinidad and TobagoTurkeyUgandaUkraineUruguayUzbekistanVenezuelaVietnamWest IndiesWestern AfricaWestern AsiaWestern EuropeYemenZaireZimbabweAzores
Immigrants from Cameroon
Race
Ancestry
AfghanAfricanAlaska NativeAlaskan AthabascanAlbanianAleutAlsatianAmericanApacheArabArapahoArgentineanArmenianAssyrian/Chaldean/SyriacAustralianAustrianBahamianBangladeshiBarbadianBasqueBelgianBelizeanBermudanBhutaneseBlackfeetBolivianBrazilianBritishBritish West IndianBulgarianBurmeseCajunCambodianCanadianCape VerdeanCarpatho RusynCelticCentral AmericanCentral American IndianCherokeeCheyenneChickasawChileanChineseChippewaChoctawColombianColvilleComancheCosta RicanCreeCreekCroatianCrowCubanCypriotCzechCzechoslovakianDanishDelawareDominicanDutchDutch West IndianEastern EuropeanEcuadorianEgyptianEnglishEstonianEthiopianEuropeanFijianFilipinoFinnishFrenchFrench American IndianFrench CanadianGermanGerman RussianGhanaianGreekGuamanian/ChamorroGuatemalanGuyaneseHaitianHmongHonduranHopiHoumaHungarianIcelanderIndian (Asian)IndonesianInupiatIranianIraqiIrishIroquoisIsraeliItalianJamaicanJapaneseJordanianKenyanKiowaKoreanLaotianLatvianLebaneseLiberianLithuanianLumbeeLuxembourgerMacedonianMalaysianMalteseMarshalleseMenomineeMexicanMexican American IndianMongolianMoroccanNative HawaiianNavajoNepaleseNew ZealanderNicaraguanNigerianNorthern EuropeanNorwegianOkinawanOsageOttawaPaiutePakistaniPalestinianPanamanianParaguayanPennsylvania GermanPeruvianPimaPolishPortuguesePotawatomiPuebloPuerto RicanPuget Sound SalishRomanianRussianSalvadoranSamoanScandinavianScotch-IrishScottishSeminoleSenegaleseSerbianShoshoneSierra LeoneanSiouxSlavicSlovakSloveneSomaliSouth AfricanSouth AmericanSouth American IndianSoviet UnionSpaniardSpanishSpanish AmericanSpanish American IndianSri LankanSubsaharan AfricanSudaneseSwedishSwissSyrianTaiwaneseThaiTlingit-HaidaTohono O'OdhamTonganTrinidadian and TobagonianTsimshianTurkishU.S. Virgin IslanderUgandanUkrainianUruguayanUteVenezuelanVietnameseWelshWest IndianYakamaYaquiYugoslavianYumanYup'ikZimbabwean
Immigration
NonimmigrantsImmigrantsAfghanistanAfricaAlbaniaArgentinaArmeniaAsiaAustraliaAustriaBahamasBangladeshBarbadosBelarusBelgiumBelizeBoliviaBosnia and HerzegovinaBrazilBulgariaBurma/MyanmarCabo VerdeCambodiaCameroonCanadaCaribbeanCentral AmericaChileChinaColombiaCongoCosta RicaCroatiaCubaCzechoslovakiaDenmarkDominicaDominican RepublicEastern AfricaEastern AsiaEastern EuropeEcuadorEgyptEl SalvadorEnglandEritreaEthiopiaEuropeFijiFranceGermanyGhanaGreeceGrenadaGuatemalaGuyanaHaitiHondurasHong KongHungaryIndiaIndonesiaIranIraqIrelandIsraelJamaicaJapanJordanKazakhstanKenyaKoreaKuwaitLaosLatin AmericaLatviaLebanonLiberiaLithuaniaMalaysiaMexicoMicronesiaMiddle AfricaMoldovaMoroccoNepalNetherlandsNicaraguaNigeriaNorth AmericaNorth MacedoniaNorthern AfricaNorthern EuropeNorwayOceaniaPakistanPanamaPeruPhilippinesPolandPortugalRomaniaRussiaSaudi ArabiaScotlandSenegalSerbiaSierra LeoneSingaporeSomaliaSouth AfricaSouth AmericaSouth Central AsiaSouth Eastern AsiaSouthern EuropeSpainSri LankaSt. Vincent and the GrenadinesSudanSwedenSwitzerlandSyriaTaiwanThailandTrinidad and TobagoTurkeyUgandaUkraineUruguayUzbekistanVenezuelaVietnamWest IndiesWestern AfricaWestern AsiaWestern EuropeYemenZaireZimbabweAzores
High School Diploma
Income
Poverty
Unemployment
Labor Participation
Family Structure
Vehicle Availability
Education Level
Disability

High School Diploma Comparison

Immigrants from Italy

Immigrants from Cameroon

Excellent
Poor
89.8%
HIGH SCHOOL DIPLOMA
87.4/ 100
METRIC RATING
131st/ 347
METRIC RANK
88.4%
HIGH SCHOOL DIPLOMA
10.9/ 100
METRIC RATING
214th/ 347
METRIC RANK

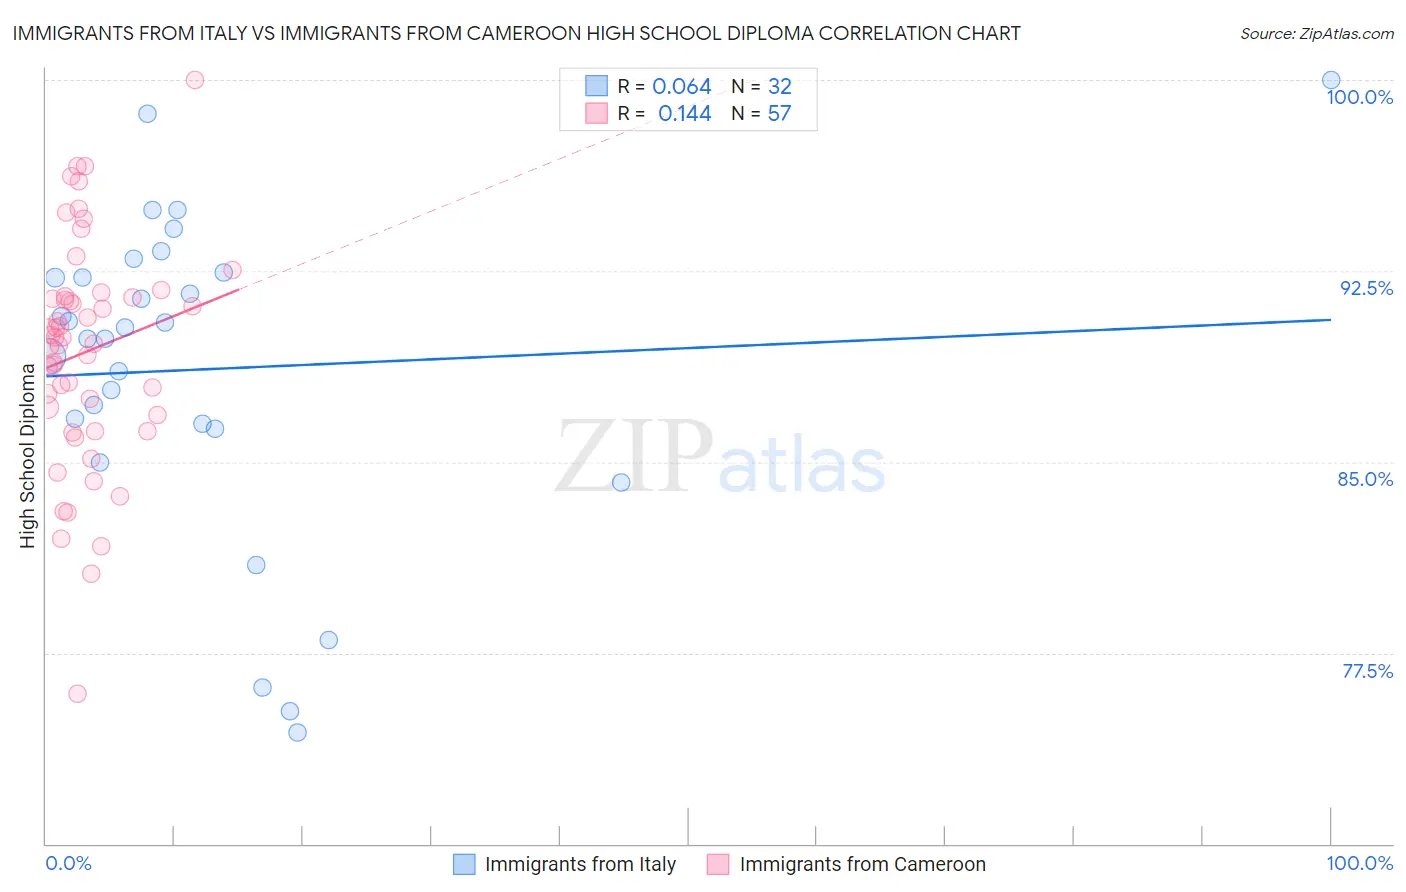
Immigrants from Italy vs Immigrants from Cameroon High School Diploma Correlation Chart

The statistical analysis conducted on geographies consisting of 324,226,009 people shows a slight positive correlation between the proportion of Immigrants from Italy and percentage of population with at least high school diploma education in the United States with a correlation coefficient (R) of 0.064 and weighted average of 89.8%. Similarly, the statistical analysis conducted on geographies consisting of 130,618,704 people shows a poor positive correlation between the proportion of Immigrants from Cameroon and percentage of population with at least high school diploma education in the United States with a correlation coefficient (R) of 0.144 and weighted average of 88.4%, a difference of 1.5%.
Immigrants from Italy vs Immigrants from Cameroon High School Diploma

High School Diploma Correlation Summary

MeasurementImmigrants from ItalyImmigrants from Cameroon
Minimum74.4%75.9%
Maximum100.0%100.0%
Range25.6%24.1%
Mean88.6%89.3%
Median90.0%89.9%
Interquartile 25% (IQ1)86.4%86.5%
Interquartile 75% (IQ3)92.3%91.5%
Interquartile Range (IQR)6.0%4.9%
Standard Deviation (Sample)6.3%4.5%
Standard Deviation (Population)6.2%4.4%

Similar Demographics by High School Diploma

Demographics Similar to Immigrants from Italy by High School Diploma

In terms of high school diploma, the demographic groups most similar to Immigrants from Italy are Immigrants from Bosnia and Herzegovina (89.8%, a difference of 0.0%), Albanian (89.8%, a difference of 0.010%), Immigrants from Jordan (89.8%, a difference of 0.010%), Immigrants from Ukraine (89.8%, a difference of 0.020%), and Basque (89.8%, a difference of 0.040%).
DemographicsRating | RankHigh School Diploma
Mongolians
91.6
/100
|
#124
Exceptional
89.9%
Egyptians
91.1
/100
|
#125
Exceptional
89.9%
Alaska Natives
91.0
/100
|
#126
Exceptional
89.9%
Immigrants | Eastern Asia
89.2
/100
|
#127
Excellent
89.9%
Puget Sound Salish
89.1
/100
|
#128
Excellent
89.9%
Basques
88.5
/100
|
#129
Excellent
89.8%
Immigrants | Ukraine
87.9
/100
|
#130
Excellent
89.8%
Immigrants | Italy
87.4
/100
|
#131
Excellent
89.8%
Immigrants | Bosnia and Herzegovina
87.3
/100
|
#132
Excellent
89.8%
Albanians
87.2
/100
|
#133
Excellent
89.8%
Immigrants | Jordan
87.2
/100
|
#134
Excellent
89.8%
Chippewa
85.6
/100
|
#135
Excellent
89.7%
Ugandans
83.7
/100
|
#136
Excellent
89.7%
Arabs
83.6
/100
|
#137
Excellent
89.7%
Assyrians/Chaldeans/Syriacs
82.5
/100
|
#138
Excellent
89.7%

Demographics Similar to Immigrants from Cameroon by High School Diploma

In terms of high school diploma, the demographic groups most similar to Immigrants from Cameroon are Crow (88.4%, a difference of 0.0%), Immigrants from Somalia (88.4%, a difference of 0.010%), Chickasaw (88.4%, a difference of 0.010%), Immigrants from Africa (88.4%, a difference of 0.010%), and Immigrants from Bolivia (88.4%, a difference of 0.030%).
DemographicsRating | RankHigh School Diploma
Immigrants | Sierra Leone
15.8
/100
|
#207
Poor
88.6%
Portuguese
14.4
/100
|
#208
Poor
88.5%
Cherokee
14.3
/100
|
#209
Poor
88.5%
Samoans
14.0
/100
|
#210
Poor
88.5%
Inupiat
13.1
/100
|
#211
Poor
88.5%
South American Indians
12.2
/100
|
#212
Poor
88.5%
Immigrants | Somalia
11.3
/100
|
#213
Poor
88.4%
Immigrants | Cameroon
10.9
/100
|
#214
Poor
88.4%
Crow
10.9
/100
|
#215
Poor
88.4%
Chickasaw
10.7
/100
|
#216
Poor
88.4%
Immigrants | Africa
10.6
/100
|
#217
Poor
88.4%
Immigrants | Bolivia
10.3
/100
|
#218
Poor
88.4%
Costa Ricans
9.6
/100
|
#219
Tragic
88.4%
Tongans
9.5
/100
|
#220
Tragic
88.4%
Immigrants | Afghanistan
8.6
/100
|
#221
Tragic
88.3%