German vs Immigrants from Cameroon High School Diploma
COMPARE
German
Immigrants from Cameroon
High School Diploma
High School Diploma Comparison
Germans
Immigrants from Cameroon
91.7%
HIGH SCHOOL DIPLOMA
99.9/ 100
METRIC RATING
18th/ 347
METRIC RANK
88.4%
HIGH SCHOOL DIPLOMA
10.9/ 100
METRIC RATING
214th/ 347
METRIC RANK
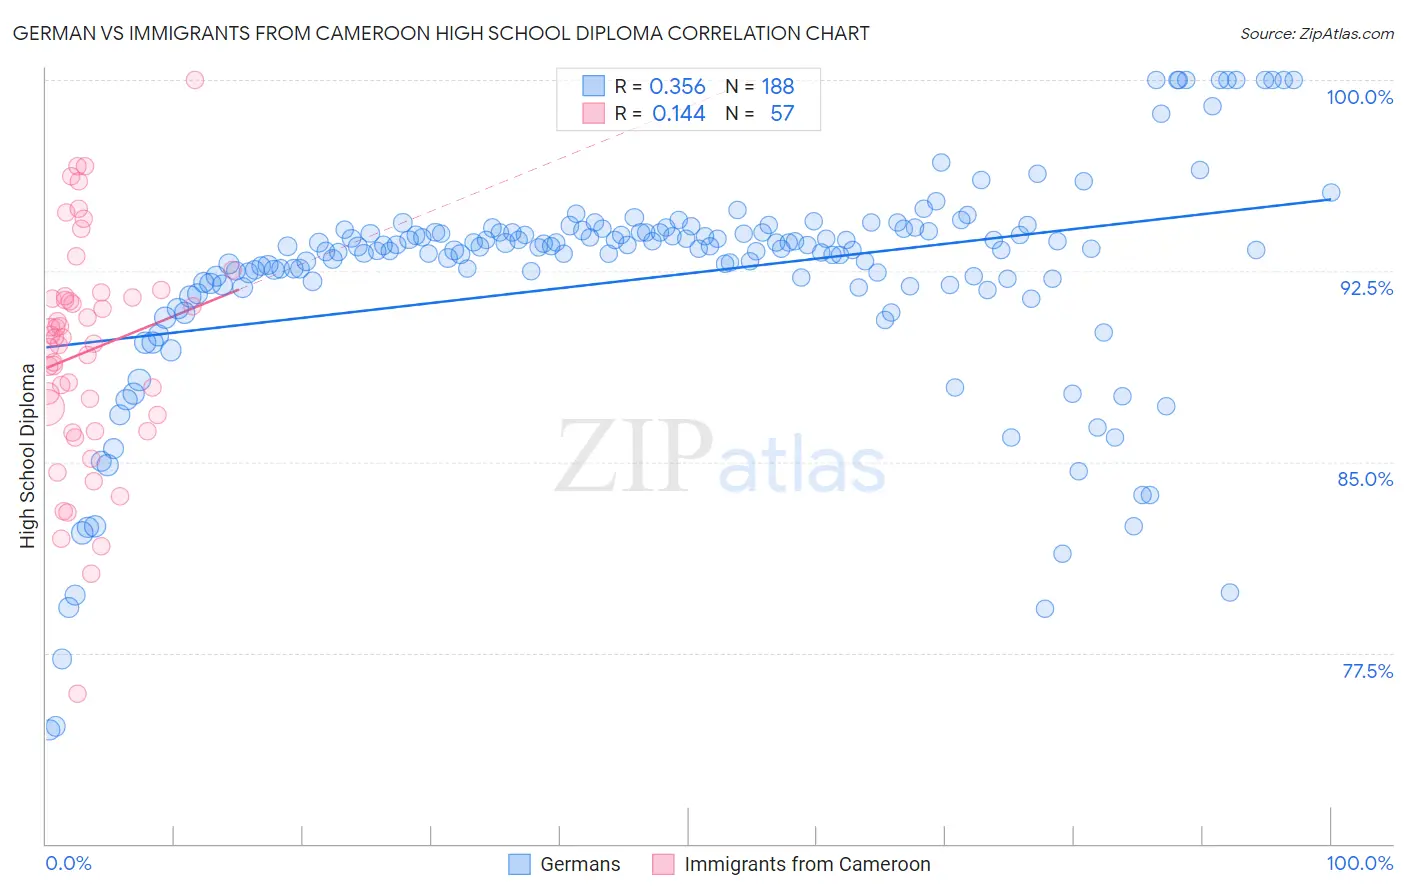
German vs Immigrants from Cameroon High School Diploma Correlation Chart
The statistical analysis conducted on geographies consisting of 581,301,082 people shows a mild positive correlation between the proportion of Germans and percentage of population with at least high school diploma education in the United States with a correlation coefficient (R) of 0.356 and weighted average of 91.7%. Similarly, the statistical analysis conducted on geographies consisting of 130,618,704 people shows a poor positive correlation between the proportion of Immigrants from Cameroon and percentage of population with at least high school diploma education in the United States with a correlation coefficient (R) of 0.144 and weighted average of 88.4%, a difference of 3.7%.
High School Diploma Correlation Summary
| Measurement | German | Immigrants from Cameroon |
| Minimum | 74.5% | 75.9% |
| Maximum | 100.0% | 100.0% |
| Range | 25.5% | 24.1% |
| Mean | 92.2% | 89.3% |
| Median | 93.4% | 89.9% |
| Interquartile 25% (IQ1) | 91.9% | 86.5% |
| Interquartile 75% (IQ3) | 94.0% | 91.5% |
| Interquartile Range (IQR) | 2.1% | 4.9% |
| Standard Deviation (Sample) | 4.5% | 4.5% |
| Standard Deviation (Population) | 4.5% | 4.4% |
Similar Demographics by High School Diploma
Demographics Similar to Germans by High School Diploma
In terms of high school diploma, the demographic groups most similar to Germans are Immigrants from Singapore (91.7%, a difference of 0.010%), Finnish (91.7%, a difference of 0.050%), Luxembourger (91.7%, a difference of 0.070%), Maltese (91.6%, a difference of 0.080%), and Bulgarian (91.8%, a difference of 0.10%).
| Demographics | Rating | Rank | High School Diploma |
| Eastern Europeans | 100.0 /100 | #11 | Exceptional 91.9% |
| Poles | 100.0 /100 | #12 | Exceptional 91.9% |
| Danes | 100.0 /100 | #13 | Exceptional 91.8% |
| Bulgarians | 100.0 /100 | #14 | Exceptional 91.8% |
| Luxembourgers | 100.0 /100 | #15 | Exceptional 91.7% |
| Finns | 100.0 /100 | #16 | Exceptional 91.7% |
| Immigrants | Singapore | 99.9 /100 | #17 | Exceptional 91.7% |
| Germans | 99.9 /100 | #18 | Exceptional 91.7% |
| Maltese | 99.9 /100 | #19 | Exceptional 91.6% |
| Czechs | 99.9 /100 | #20 | Exceptional 91.6% |
| Filipinos | 99.9 /100 | #21 | Exceptional 91.6% |
| Estonians | 99.9 /100 | #22 | Exceptional 91.6% |
| Scandinavians | 99.9 /100 | #23 | Exceptional 91.5% |
| Italians | 99.9 /100 | #24 | Exceptional 91.5% |
| Thais | 99.9 /100 | #25 | Exceptional 91.5% |
Demographics Similar to Immigrants from Cameroon by High School Diploma
In terms of high school diploma, the demographic groups most similar to Immigrants from Cameroon are Crow (88.4%, a difference of 0.0%), Immigrants from Somalia (88.4%, a difference of 0.010%), Chickasaw (88.4%, a difference of 0.010%), Immigrants from Africa (88.4%, a difference of 0.010%), and Immigrants from Bolivia (88.4%, a difference of 0.030%).
| Demographics | Rating | Rank | High School Diploma |
| Immigrants | Sierra Leone | 15.8 /100 | #207 | Poor 88.6% |
| Portuguese | 14.4 /100 | #208 | Poor 88.5% |
| Cherokee | 14.3 /100 | #209 | Poor 88.5% |
| Samoans | 14.0 /100 | #210 | Poor 88.5% |
| Inupiat | 13.1 /100 | #211 | Poor 88.5% |
| South American Indians | 12.2 /100 | #212 | Poor 88.5% |
| Immigrants | Somalia | 11.3 /100 | #213 | Poor 88.4% |
| Immigrants | Cameroon | 10.9 /100 | #214 | Poor 88.4% |
| Crow | 10.9 /100 | #215 | Poor 88.4% |
| Chickasaw | 10.7 /100 | #216 | Poor 88.4% |
| Immigrants | Africa | 10.6 /100 | #217 | Poor 88.4% |
| Immigrants | Bolivia | 10.3 /100 | #218 | Poor 88.4% |
| Costa Ricans | 9.6 /100 | #219 | Tragic 88.4% |
| Tongans | 9.5 /100 | #220 | Tragic 88.4% |
| Immigrants | Afghanistan | 8.6 /100 | #221 | Tragic 88.3% |