Immigrants from Israel vs Fijian Doctorate Degree
COMPARE
Immigrants from Israel
Fijian
Doctorate Degree
Doctorate Degree Comparison
Immigrants from Israel
Fijians
3.0%
DOCTORATE DEGREE
100.0/ 100
METRIC RATING
8th/ 347
METRIC RANK
1.1%
DOCTORATE DEGREE
0.0/ 100
METRIC RATING
343rd/ 347
METRIC RANK
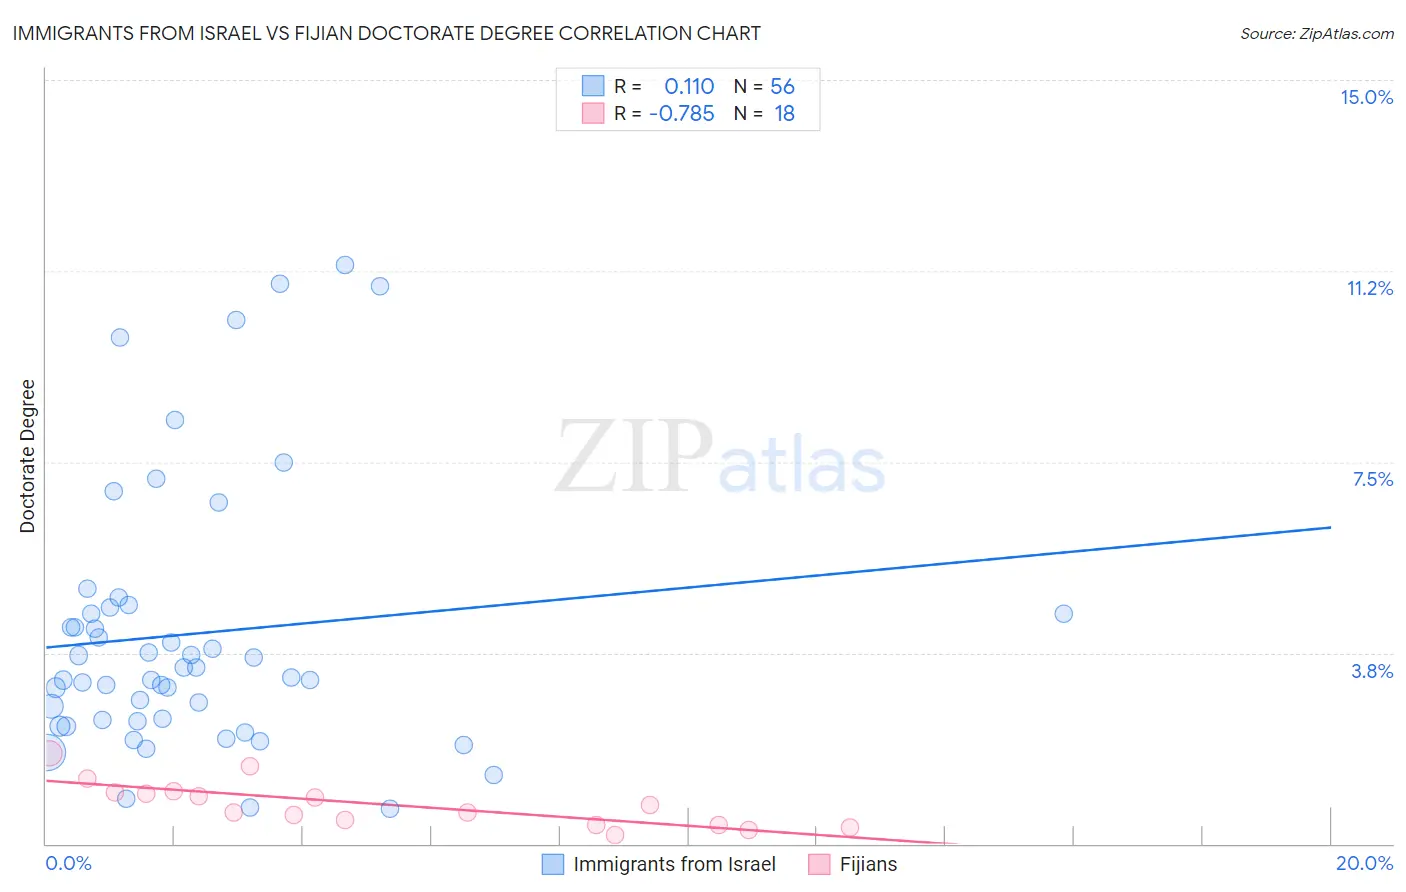
Immigrants from Israel vs Fijian Doctorate Degree Correlation Chart
The statistical analysis conducted on geographies consisting of 209,560,574 people shows a poor positive correlation between the proportion of Immigrants from Israel and percentage of population with at least doctorate degree education in the United States with a correlation coefficient (R) of 0.110 and weighted average of 3.0%. Similarly, the statistical analysis conducted on geographies consisting of 55,685,158 people shows a strong negative correlation between the proportion of Fijians and percentage of population with at least doctorate degree education in the United States with a correlation coefficient (R) of -0.785 and weighted average of 1.1%, a difference of 170.0%.
Doctorate Degree Correlation Summary
| Measurement | Immigrants from Israel | Fijian |
| Minimum | 0.70% | 0.18% |
| Maximum | 11.4% | 1.8% |
| Range | 10.7% | 1.6% |
| Mean | 4.1% | 0.78% |
| Median | 3.4% | 0.68% |
| Interquartile 25% (IQ1) | 2.4% | 0.37% |
| Interquartile 75% (IQ3) | 4.6% | 1.0% |
| Interquartile Range (IQR) | 2.2% | 0.64% |
| Standard Deviation (Sample) | 2.6% | 0.45% |
| Standard Deviation (Population) | 2.6% | 0.43% |
Similar Demographics by Doctorate Degree
Demographics Similar to Immigrants from Israel by Doctorate Degree
In terms of doctorate degree, the demographic groups most similar to Immigrants from Israel are Immigrants from Iran (3.0%, a difference of 0.67%), Immigrants from China (3.1%, a difference of 1.3%), Immigrants from Switzerland (3.1%, a difference of 1.4%), Immigrants from Eastern Asia (3.0%, a difference of 2.8%), and Iranian (3.1%, a difference of 3.3%).
| Demographics | Rating | Rank | Doctorate Degree |
| Immigrants | Singapore | 100.0 /100 | #1 | Exceptional 3.7% |
| Filipinos | 100.0 /100 | #2 | Exceptional 3.4% |
| Okinawans | 100.0 /100 | #3 | Exceptional 3.3% |
| Immigrants | Taiwan | 100.0 /100 | #4 | Exceptional 3.2% |
| Iranians | 100.0 /100 | #5 | Exceptional 3.1% |
| Immigrants | Switzerland | 100.0 /100 | #6 | Exceptional 3.1% |
| Immigrants | China | 100.0 /100 | #7 | Exceptional 3.1% |
| Immigrants | Israel | 100.0 /100 | #8 | Exceptional 3.0% |
| Immigrants | Iran | 100.0 /100 | #9 | Exceptional 3.0% |
| Immigrants | Eastern Asia | 100.0 /100 | #10 | Exceptional 3.0% |
| Indians (Asian) | 100.0 /100 | #11 | Exceptional 2.9% |
| Immigrants | Belgium | 100.0 /100 | #12 | Exceptional 2.9% |
| Immigrants | Sweden | 100.0 /100 | #13 | Exceptional 2.9% |
| Immigrants | France | 100.0 /100 | #14 | Exceptional 2.9% |
| Immigrants | India | 100.0 /100 | #15 | Exceptional 2.8% |
Demographics Similar to Fijians by Doctorate Degree
In terms of doctorate degree, the demographic groups most similar to Fijians are Immigrants from Mexico (1.1%, a difference of 2.1%), Arapaho (1.2%, a difference of 3.4%), Lumbee (1.1%, a difference of 3.6%), Mexican (1.2%, a difference of 3.8%), and Immigrants from Cuba (1.2%, a difference of 4.3%).
| Demographics | Rating | Rank | Doctorate Degree |
| Immigrants | Caribbean | 0.0 /100 | #333 | Tragic 1.3% |
| Immigrants | Dominican Republic | 0.0 /100 | #334 | Tragic 1.3% |
| Immigrants | Haiti | 0.0 /100 | #335 | Tragic 1.3% |
| Nepalese | 0.0 /100 | #336 | Tragic 1.3% |
| Bangladeshis | 0.0 /100 | #337 | Tragic 1.2% |
| Puget Sound Salish | 0.0 /100 | #338 | Tragic 1.2% |
| Immigrants | Central America | 0.0 /100 | #339 | Tragic 1.2% |
| Immigrants | Cuba | 0.0 /100 | #340 | Tragic 1.2% |
| Mexicans | 0.0 /100 | #341 | Tragic 1.2% |
| Arapaho | 0.0 /100 | #342 | Tragic 1.2% |
| Fijians | 0.0 /100 | #343 | Tragic 1.1% |
| Immigrants | Mexico | 0.0 /100 | #344 | Tragic 1.1% |
| Lumbee | 0.0 /100 | #345 | Tragic 1.1% |
| Spanish American Indians | 0.0 /100 | #346 | Tragic 1.1% |
| Houma | 0.0 /100 | #347 | Tragic 0.96% |