Immigrants from the Azores vs Fijian Doctorate Degree
COMPARE
Immigrants from the Azores
Fijian
Doctorate Degree
Doctorate Degree Comparison
Immigrants from the Azores
Fijians
1.4%
DOCTORATE DEGREE
0.1/ 100
METRIC RATING
315th/ 347
METRIC RANK
1.1%
DOCTORATE DEGREE
0.0/ 100
METRIC RATING
343rd/ 347
METRIC RANK
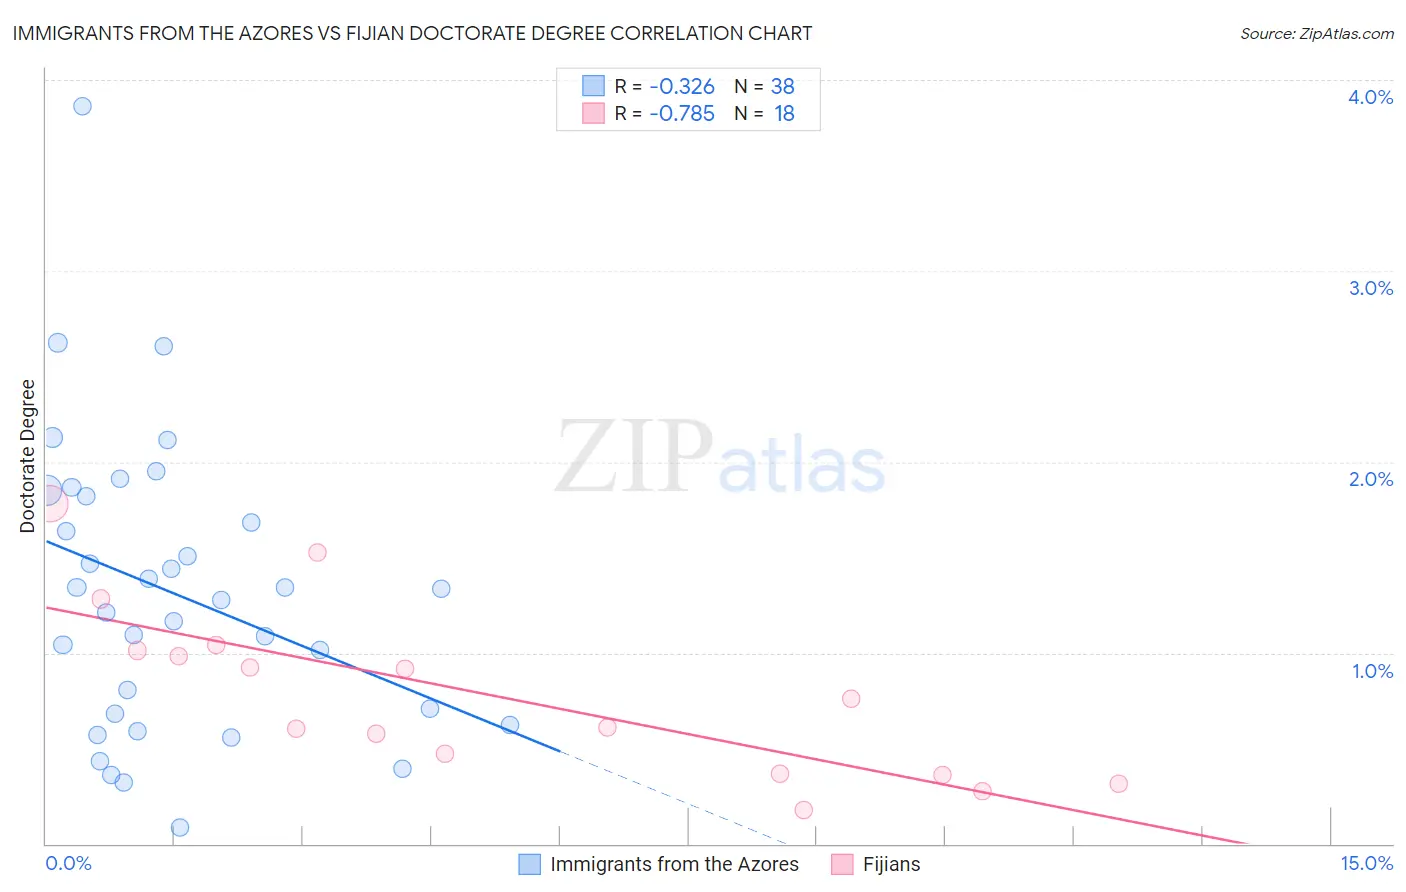
Immigrants from the Azores vs Fijian Doctorate Degree Correlation Chart
The statistical analysis conducted on geographies consisting of 46,011,350 people shows a mild negative correlation between the proportion of Immigrants from the Azores and percentage of population with at least doctorate degree education in the United States with a correlation coefficient (R) of -0.326 and weighted average of 1.4%. Similarly, the statistical analysis conducted on geographies consisting of 55,685,158 people shows a strong negative correlation between the proportion of Fijians and percentage of population with at least doctorate degree education in the United States with a correlation coefficient (R) of -0.785 and weighted average of 1.1%, a difference of 19.9%.
Doctorate Degree Correlation Summary
| Measurement | Immigrants from the Azores | Fijian |
| Minimum | 0.085% | 0.18% |
| Maximum | 3.9% | 1.8% |
| Range | 3.8% | 1.6% |
| Mean | 1.3% | 0.78% |
| Median | 1.3% | 0.68% |
| Interquartile 25% (IQ1) | 0.68% | 0.37% |
| Interquartile 75% (IQ3) | 1.8% | 1.0% |
| Interquartile Range (IQR) | 1.1% | 0.64% |
| Standard Deviation (Sample) | 0.76% | 0.45% |
| Standard Deviation (Population) | 0.75% | 0.43% |
Similar Demographics by Doctorate Degree
Demographics Similar to Immigrants from the Azores by Doctorate Degree
In terms of doctorate degree, the demographic groups most similar to Immigrants from the Azores are Dominican (1.4%, a difference of 0.020%), Menominee (1.4%, a difference of 0.10%), Navajo (1.4%, a difference of 0.21%), Immigrants from Nicaragua (1.4%, a difference of 0.42%), and Immigrants from Micronesia (1.3%, a difference of 0.45%).
| Demographics | Rating | Rank | Doctorate Degree |
| Immigrants | Laos | 0.1 /100 | #308 | Tragic 1.4% |
| Immigrants | Grenada | 0.1 /100 | #309 | Tragic 1.4% |
| Immigrants | Jamaica | 0.1 /100 | #310 | Tragic 1.4% |
| Immigrants | Honduras | 0.1 /100 | #311 | Tragic 1.4% |
| Immigrants | Nicaragua | 0.1 /100 | #312 | Tragic 1.4% |
| Menominee | 0.1 /100 | #313 | Tragic 1.4% |
| Dominicans | 0.1 /100 | #314 | Tragic 1.4% |
| Immigrants | Azores | 0.1 /100 | #315 | Tragic 1.4% |
| Navajo | 0.1 /100 | #316 | Tragic 1.4% |
| Immigrants | Micronesia | 0.1 /100 | #317 | Tragic 1.3% |
| Creek | 0.1 /100 | #318 | Tragic 1.3% |
| Immigrants | Guyana | 0.1 /100 | #319 | Tragic 1.3% |
| Immigrants | St. Vincent and the Grenadines | 0.1 /100 | #320 | Tragic 1.3% |
| Dutch West Indians | 0.1 /100 | #321 | Tragic 1.3% |
| Seminole | 0.1 /100 | #322 | Tragic 1.3% |
Demographics Similar to Fijians by Doctorate Degree
In terms of doctorate degree, the demographic groups most similar to Fijians are Immigrants from Mexico (1.1%, a difference of 2.1%), Arapaho (1.2%, a difference of 3.4%), Lumbee (1.1%, a difference of 3.6%), Mexican (1.2%, a difference of 3.8%), and Immigrants from Cuba (1.2%, a difference of 4.3%).
| Demographics | Rating | Rank | Doctorate Degree |
| Immigrants | Caribbean | 0.0 /100 | #333 | Tragic 1.3% |
| Immigrants | Dominican Republic | 0.0 /100 | #334 | Tragic 1.3% |
| Immigrants | Haiti | 0.0 /100 | #335 | Tragic 1.3% |
| Nepalese | 0.0 /100 | #336 | Tragic 1.3% |
| Bangladeshis | 0.0 /100 | #337 | Tragic 1.2% |
| Puget Sound Salish | 0.0 /100 | #338 | Tragic 1.2% |
| Immigrants | Central America | 0.0 /100 | #339 | Tragic 1.2% |
| Immigrants | Cuba | 0.0 /100 | #340 | Tragic 1.2% |
| Mexicans | 0.0 /100 | #341 | Tragic 1.2% |
| Arapaho | 0.0 /100 | #342 | Tragic 1.2% |
| Fijians | 0.0 /100 | #343 | Tragic 1.1% |
| Immigrants | Mexico | 0.0 /100 | #344 | Tragic 1.1% |
| Lumbee | 0.0 /100 | #345 | Tragic 1.1% |
| Spanish American Indians | 0.0 /100 | #346 | Tragic 1.1% |
| Houma | 0.0 /100 | #347 | Tragic 0.96% |