Immigrants from Iraq vs Immigrants from Western Asia 5th Grade
COMPARE
Immigrants from Iraq
Immigrants from Western Asia
5th Grade
5th Grade Comparison
Immigrants from Iraq
Immigrants from Western Asia
97.1%
5TH GRADE
8.3/ 100
METRIC RATING
212th/ 347
METRIC RANK
97.0%
5TH GRADE
4.3/ 100
METRIC RATING
230th/ 347
METRIC RANK
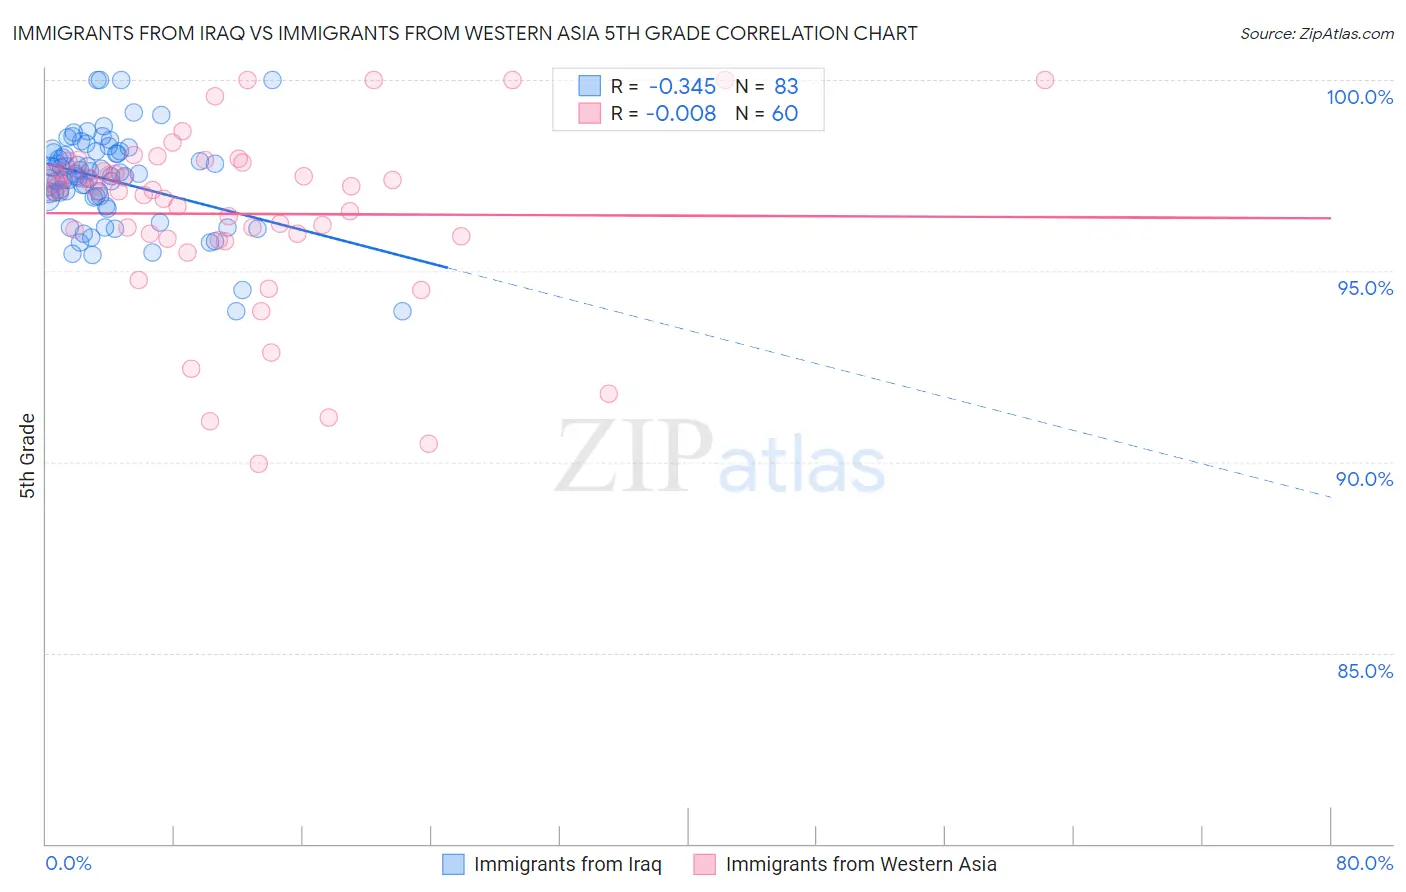
Immigrants from Iraq vs Immigrants from Western Asia 5th Grade Correlation Chart
The statistical analysis conducted on geographies consisting of 194,632,332 people shows a mild negative correlation between the proportion of Immigrants from Iraq and percentage of population with at least 5th grade education in the United States with a correlation coefficient (R) of -0.345 and weighted average of 97.1%. Similarly, the statistical analysis conducted on geographies consisting of 404,424,892 people shows no correlation between the proportion of Immigrants from Western Asia and percentage of population with at least 5th grade education in the United States with a correlation coefficient (R) of -0.008 and weighted average of 97.0%, a difference of 0.070%.
5th Grade Correlation Summary
| Measurement | Immigrants from Iraq | Immigrants from Western Asia |
| Minimum | 93.9% | 90.0% |
| Maximum | 100.0% | 100.0% |
| Range | 6.1% | 10.0% |
| Mean | 97.4% | 96.5% |
| Median | 97.5% | 97.1% |
| Interquartile 25% (IQ1) | 96.9% | 95.9% |
| Interquartile 75% (IQ3) | 98.1% | 97.7% |
| Interquartile Range (IQR) | 1.2% | 1.9% |
| Standard Deviation (Sample) | 1.2% | 2.3% |
| Standard Deviation (Population) | 1.2% | 2.3% |
Demographics Similar to Immigrants from Iraq and Immigrants from Western Asia by 5th Grade
In terms of 5th grade, the demographic groups most similar to Immigrants from Iraq are Samoan (97.1%, a difference of 0.0%), Portuguese (97.1%, a difference of 0.010%), Costa Rican (97.1%, a difference of 0.010%), Immigrants from Morocco (97.1%, a difference of 0.010%), and Sudanese (97.1%, a difference of 0.020%). Similarly, the demographic groups most similar to Immigrants from Western Asia are Assyrian/Chaldean/Syriac (97.0%, a difference of 0.0%), Yuman (97.0%, a difference of 0.0%), Immigrants from Pakistan (97.0%, a difference of 0.010%), Immigrants from Malaysia (97.0%, a difference of 0.010%), and South American Indian (97.0%, a difference of 0.020%).
| Demographics | Rating | Rank | 5th Grade |
| Samoans | 8.5 /100 | #211 | Tragic 97.1% |
| Immigrants | Iraq | 8.3 /100 | #212 | Tragic 97.1% |
| Portuguese | 7.8 /100 | #213 | Tragic 97.1% |
| Costa Ricans | 7.7 /100 | #214 | Tragic 97.1% |
| Immigrants | Morocco | 7.5 /100 | #215 | Tragic 97.1% |
| Sudanese | 7.0 /100 | #216 | Tragic 97.1% |
| Immigrants | Lebanon | 6.8 /100 | #217 | Tragic 97.1% |
| Immigrants | Sudan | 6.5 /100 | #218 | Tragic 97.1% |
| Immigrants | Syria | 6.4 /100 | #219 | Tragic 97.1% |
| Immigrants | Southern Europe | 6.3 /100 | #220 | Tragic 97.1% |
| Sierra Leoneans | 6.0 /100 | #221 | Tragic 97.1% |
| Immigrants | Panama | 5.7 /100 | #222 | Tragic 97.0% |
| Liberians | 5.7 /100 | #223 | Tragic 97.0% |
| South American Indians | 5.4 /100 | #224 | Tragic 97.0% |
| Bahamians | 5.3 /100 | #225 | Tragic 97.0% |
| Tongans | 5.3 /100 | #226 | Tragic 97.0% |
| Immigrants | Pakistan | 4.7 /100 | #227 | Tragic 97.0% |
| Assyrians/Chaldeans/Syriacs | 4.5 /100 | #228 | Tragic 97.0% |
| Yuman | 4.5 /100 | #229 | Tragic 97.0% |
| Immigrants | Western Asia | 4.3 /100 | #230 | Tragic 97.0% |
| Immigrants | Malaysia | 4.1 /100 | #231 | Tragic 97.0% |