Immigrants from Iraq vs Chickasaw 5th Grade
COMPARE
Immigrants from Iraq
Chickasaw
5th Grade
5th Grade Comparison
Immigrants from Iraq
Chickasaw
97.1%
5TH GRADE
8.3/ 100
METRIC RATING
212th/ 347
METRIC RANK
97.9%
5TH GRADE
99.5/ 100
METRIC RATING
71st/ 347
METRIC RANK
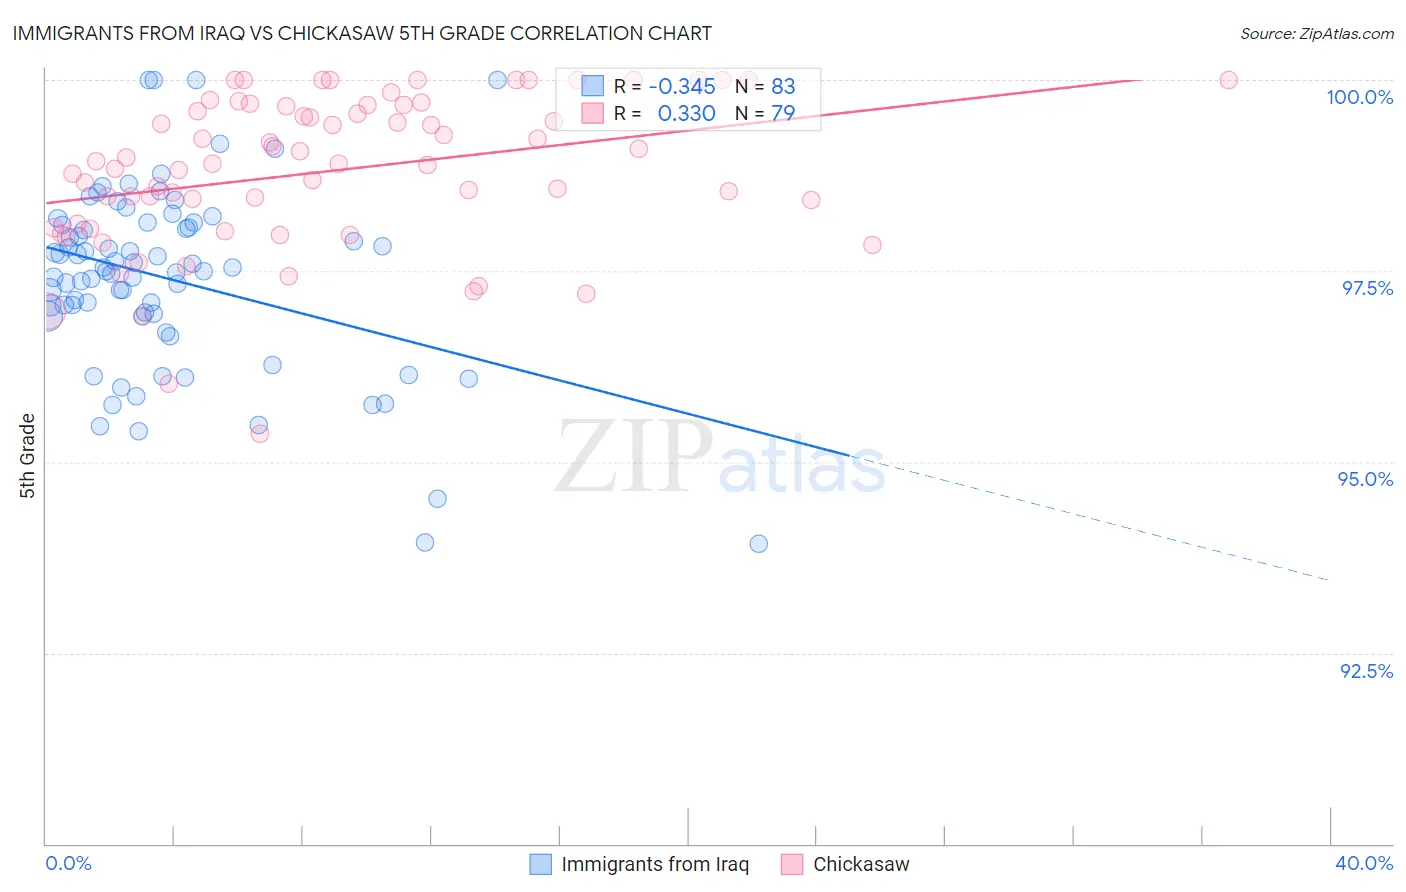
Immigrants from Iraq vs Chickasaw 5th Grade Correlation Chart
The statistical analysis conducted on geographies consisting of 194,632,332 people shows a mild negative correlation between the proportion of Immigrants from Iraq and percentage of population with at least 5th grade education in the United States with a correlation coefficient (R) of -0.345 and weighted average of 97.1%. Similarly, the statistical analysis conducted on geographies consisting of 147,726,545 people shows a mild positive correlation between the proportion of Chickasaw and percentage of population with at least 5th grade education in the United States with a correlation coefficient (R) of 0.330 and weighted average of 97.9%, a difference of 0.79%.
5th Grade Correlation Summary
| Measurement | Immigrants from Iraq | Chickasaw |
| Minimum | 93.9% | 95.4% |
| Maximum | 100.0% | 100.0% |
| Range | 6.1% | 4.6% |
| Mean | 97.4% | 98.8% |
| Median | 97.5% | 98.9% |
| Interquartile 25% (IQ1) | 96.9% | 98.1% |
| Interquartile 75% (IQ3) | 98.1% | 99.7% |
| Interquartile Range (IQR) | 1.2% | 1.6% |
| Standard Deviation (Sample) | 1.2% | 1.0% |
| Standard Deviation (Population) | 1.2% | 1.00% |
Similar Demographics by 5th Grade
Demographics Similar to Immigrants from Iraq by 5th Grade
In terms of 5th grade, the demographic groups most similar to Immigrants from Iraq are Samoan (97.1%, a difference of 0.0%), Portuguese (97.1%, a difference of 0.010%), Costa Rican (97.1%, a difference of 0.010%), Immigrants from Morocco (97.1%, a difference of 0.010%), and Immigrants from Nepal (97.1%, a difference of 0.020%).
| Demographics | Rating | Rank | 5th Grade |
| Moroccans | 12.0 /100 | #205 | Poor 97.1% |
| Paiute | 11.6 /100 | #206 | Poor 97.1% |
| Iraqis | 10.9 /100 | #207 | Poor 97.1% |
| Laotians | 10.8 /100 | #208 | Poor 97.1% |
| Immigrants | Nepal | 10.3 /100 | #209 | Poor 97.1% |
| Immigrants | Oceania | 10.0 /100 | #210 | Poor 97.1% |
| Samoans | 8.5 /100 | #211 | Tragic 97.1% |
| Immigrants | Iraq | 8.3 /100 | #212 | Tragic 97.1% |
| Portuguese | 7.8 /100 | #213 | Tragic 97.1% |
| Costa Ricans | 7.7 /100 | #214 | Tragic 97.1% |
| Immigrants | Morocco | 7.5 /100 | #215 | Tragic 97.1% |
| Sudanese | 7.0 /100 | #216 | Tragic 97.1% |
| Immigrants | Lebanon | 6.8 /100 | #217 | Tragic 97.1% |
| Immigrants | Sudan | 6.5 /100 | #218 | Tragic 97.1% |
| Immigrants | Syria | 6.4 /100 | #219 | Tragic 97.1% |
Demographics Similar to Chickasaw by 5th Grade
In terms of 5th grade, the demographic groups most similar to Chickasaw are Iranian (97.9%, a difference of 0.0%), Kiowa (97.9%, a difference of 0.010%), Macedonian (97.9%, a difference of 0.010%), Cajun (97.9%, a difference of 0.020%), and Cherokee (97.8%, a difference of 0.020%).
| Demographics | Rating | Rank | 5th Grade |
| Immigrants | Northern Europe | 99.6 /100 | #64 | Exceptional 97.9% |
| Canadians | 99.6 /100 | #65 | Exceptional 97.9% |
| Immigrants | Austria | 99.6 /100 | #66 | Exceptional 97.9% |
| New Zealanders | 99.6 /100 | #67 | Exceptional 97.9% |
| Cajuns | 99.6 /100 | #68 | Exceptional 97.9% |
| Kiowa | 99.5 /100 | #69 | Exceptional 97.9% |
| Iranians | 99.5 /100 | #70 | Exceptional 97.9% |
| Chickasaw | 99.5 /100 | #71 | Exceptional 97.9% |
| Macedonians | 99.4 /100 | #72 | Exceptional 97.9% |
| Cherokee | 99.4 /100 | #73 | Exceptional 97.8% |
| Lumbee | 99.3 /100 | #74 | Exceptional 97.8% |
| Ukrainians | 99.3 /100 | #75 | Exceptional 97.8% |
| Immigrants | Netherlands | 99.3 /100 | #76 | Exceptional 97.8% |
| Immigrants | England | 99.3 /100 | #77 | Exceptional 97.8% |
| Osage | 99.3 /100 | #78 | Exceptional 97.8% |