Immigrants from Iraq vs Immigrants from Japan Bachelor's Degree
COMPARE
Immigrants from Iraq
Immigrants from Japan
Bachelor's Degree
Bachelor's Degree Comparison
Immigrants from Iraq
Immigrants from Japan
37.9%
BACHELOR'S DEGREE
52.5/ 100
METRIC RATING
173rd/ 347
METRIC RANK
46.8%
BACHELOR'S DEGREE
100.0/ 100
METRIC RATING
26th/ 347
METRIC RANK
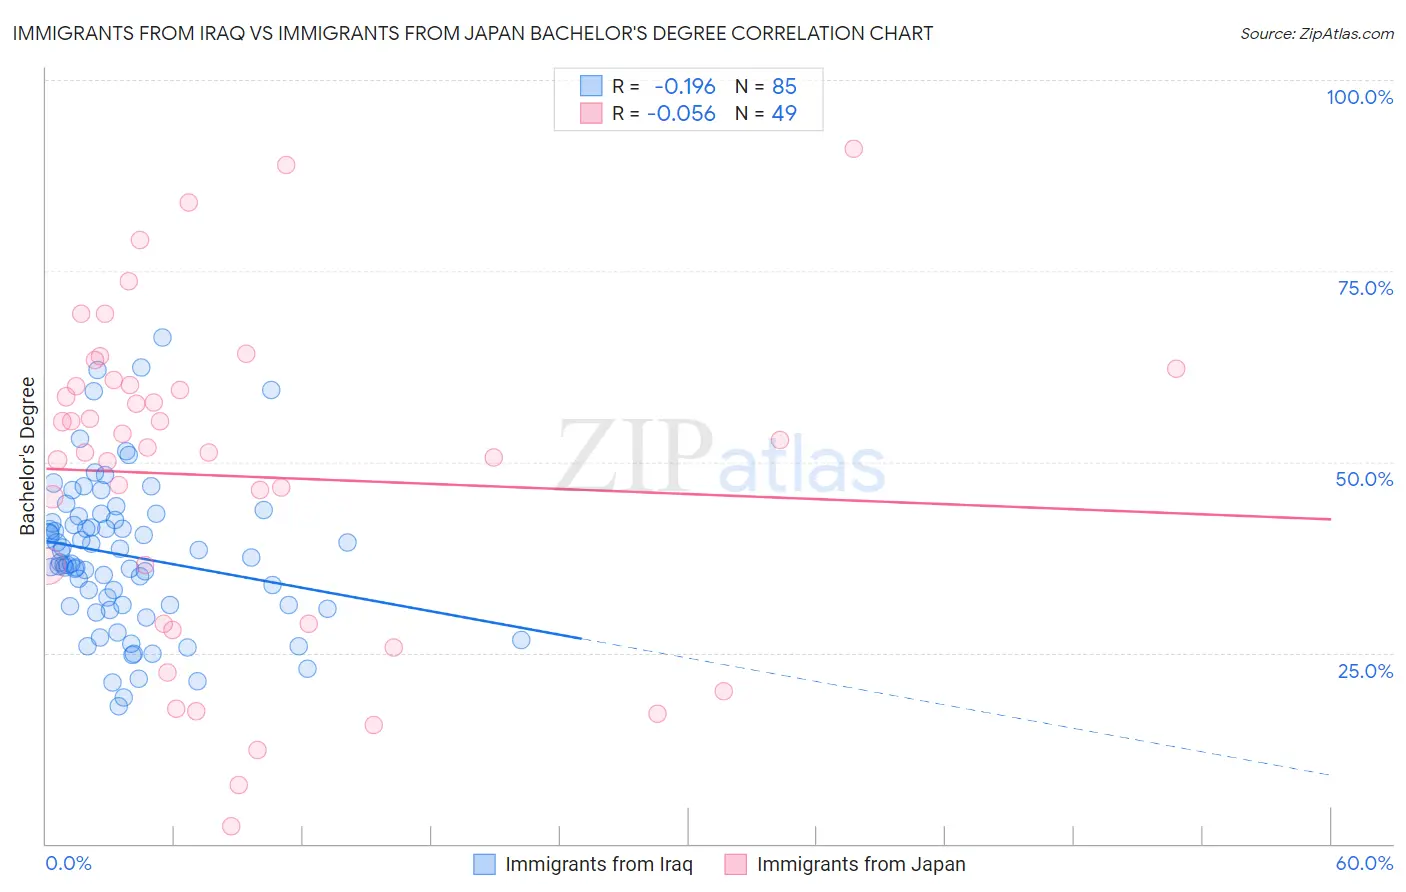
Immigrants from Iraq vs Immigrants from Japan Bachelor's Degree Correlation Chart
The statistical analysis conducted on geographies consisting of 194,775,437 people shows a poor negative correlation between the proportion of Immigrants from Iraq and percentage of population with at least bachelor's degree education in the United States with a correlation coefficient (R) of -0.196 and weighted average of 37.9%. Similarly, the statistical analysis conducted on geographies consisting of 340,124,195 people shows a slight negative correlation between the proportion of Immigrants from Japan and percentage of population with at least bachelor's degree education in the United States with a correlation coefficient (R) of -0.056 and weighted average of 46.8%, a difference of 23.5%.
Bachelor's Degree Correlation Summary
| Measurement | Immigrants from Iraq | Immigrants from Japan |
| Minimum | 18.0% | 2.2% |
| Maximum | 66.3% | 91.0% |
| Range | 48.3% | 88.7% |
| Mean | 37.7% | 48.1% |
| Median | 36.8% | 51.9% |
| Interquartile 25% (IQ1) | 31.2% | 28.8% |
| Interquartile 75% (IQ3) | 42.7% | 60.4% |
| Interquartile Range (IQR) | 11.5% | 31.6% |
| Standard Deviation (Sample) | 9.9% | 21.3% |
| Standard Deviation (Population) | 9.8% | 21.1% |
Similar Demographics by Bachelor's Degree
Demographics Similar to Immigrants from Iraq by Bachelor's Degree
In terms of bachelor's degree, the demographic groups most similar to Immigrants from Iraq are Immigrants from Somalia (37.9%, a difference of 0.020%), Bermudan (38.0%, a difference of 0.16%), Czech (38.0%, a difference of 0.18%), Immigrants from Bangladesh (37.8%, a difference of 0.25%), and Ghanaian (38.0%, a difference of 0.27%).
| Demographics | Rating | Rank | Bachelor's Degree |
| Somalis | 58.6 /100 | #166 | Average 38.1% |
| Scottish | 56.6 /100 | #167 | Average 38.1% |
| Danes | 56.2 /100 | #168 | Average 38.1% |
| Ghanaians | 55.3 /100 | #169 | Average 38.0% |
| Czechs | 54.4 /100 | #170 | Average 38.0% |
| Bermudans | 54.2 /100 | #171 | Average 38.0% |
| Immigrants | Somalia | 52.8 /100 | #172 | Average 37.9% |
| Immigrants | Iraq | 52.5 /100 | #173 | Average 37.9% |
| Immigrants | Bangladesh | 50.0 /100 | #174 | Average 37.8% |
| Immigrants | Uruguay | 48.3 /100 | #175 | Average 37.8% |
| Costa Ricans | 47.6 /100 | #176 | Average 37.7% |
| Basques | 47.4 /100 | #177 | Average 37.7% |
| Immigrants | Cameroon | 46.8 /100 | #178 | Average 37.7% |
| Immigrants | Colombia | 45.4 /100 | #179 | Average 37.7% |
| Irish | 44.3 /100 | #180 | Average 37.6% |
Demographics Similar to Immigrants from Japan by Bachelor's Degree
In terms of bachelor's degree, the demographic groups most similar to Immigrants from Japan are Burmese (46.9%, a difference of 0.10%), Immigrants from Korea (47.0%, a difference of 0.33%), Immigrants from Sweden (47.0%, a difference of 0.37%), Immigrants from Belgium (47.0%, a difference of 0.46%), and Immigrants from Ireland (47.1%, a difference of 0.66%).
| Demographics | Rating | Rank | Bachelor's Degree |
| Cambodians | 100.0 /100 | #19 | Exceptional 47.2% |
| Immigrants | Switzerland | 100.0 /100 | #20 | Exceptional 47.1% |
| Immigrants | Ireland | 100.0 /100 | #21 | Exceptional 47.1% |
| Immigrants | Belgium | 100.0 /100 | #22 | Exceptional 47.0% |
| Immigrants | Sweden | 100.0 /100 | #23 | Exceptional 47.0% |
| Immigrants | Korea | 100.0 /100 | #24 | Exceptional 47.0% |
| Burmese | 100.0 /100 | #25 | Exceptional 46.9% |
| Immigrants | Japan | 100.0 /100 | #26 | Exceptional 46.8% |
| Immigrants | France | 100.0 /100 | #27 | Exceptional 46.4% |
| Turks | 100.0 /100 | #28 | Exceptional 46.2% |
| Israelis | 100.0 /100 | #29 | Exceptional 46.1% |
| Immigrants | Sri Lanka | 100.0 /100 | #30 | Exceptional 46.1% |
| Latvians | 100.0 /100 | #31 | Exceptional 46.1% |
| Immigrants | Turkey | 100.0 /100 | #32 | Exceptional 46.0% |
| Immigrants | Northern Europe | 100.0 /100 | #33 | Exceptional 45.6% |