Dutch West Indian vs Immigrants from Japan Bachelor's Degree
COMPARE
Dutch West Indian
Immigrants from Japan
Bachelor's Degree
Bachelor's Degree Comparison
Dutch West Indians
Immigrants from Japan
28.5%
BACHELOR'S DEGREE
0.0/ 100
METRIC RATING
324th/ 347
METRIC RANK
46.8%
BACHELOR'S DEGREE
100.0/ 100
METRIC RATING
26th/ 347
METRIC RANK
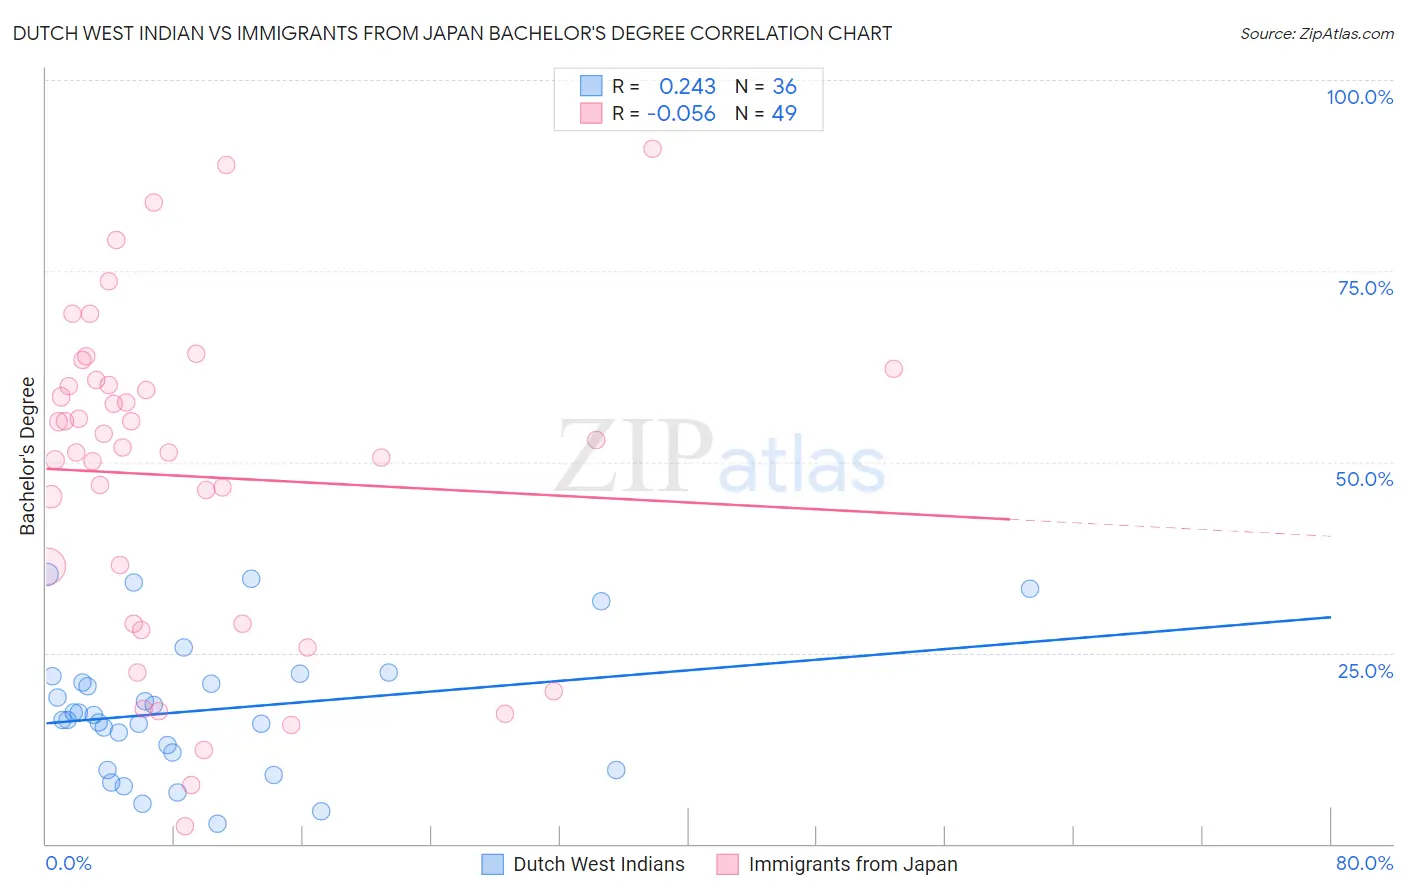
Dutch West Indian vs Immigrants from Japan Bachelor's Degree Correlation Chart
The statistical analysis conducted on geographies consisting of 85,775,011 people shows a weak positive correlation between the proportion of Dutch West Indians and percentage of population with at least bachelor's degree education in the United States with a correlation coefficient (R) of 0.243 and weighted average of 28.5%. Similarly, the statistical analysis conducted on geographies consisting of 340,124,195 people shows a slight negative correlation between the proportion of Immigrants from Japan and percentage of population with at least bachelor's degree education in the United States with a correlation coefficient (R) of -0.056 and weighted average of 46.8%, a difference of 64.2%.
Bachelor's Degree Correlation Summary
| Measurement | Dutch West Indian | Immigrants from Japan |
| Minimum | 2.6% | 2.2% |
| Maximum | 35.3% | 91.0% |
| Range | 32.6% | 88.7% |
| Mean | 17.5% | 48.1% |
| Median | 16.6% | 51.9% |
| Interquartile 25% (IQ1) | 10.8% | 28.8% |
| Interquartile 75% (IQ3) | 21.5% | 60.4% |
| Interquartile Range (IQR) | 10.7% | 31.6% |
| Standard Deviation (Sample) | 8.7% | 21.3% |
| Standard Deviation (Population) | 8.6% | 21.1% |
Similar Demographics by Bachelor's Degree
Demographics Similar to Dutch West Indians by Bachelor's Degree
In terms of bachelor's degree, the demographic groups most similar to Dutch West Indians are Pennsylvania German (28.4%, a difference of 0.45%), Fijian (28.7%, a difference of 0.71%), Apache (28.3%, a difference of 0.84%), Tsimshian (28.8%, a difference of 0.85%), and Alaskan Athabascan (28.8%, a difference of 1.1%).
| Demographics | Rating | Rank | Bachelor's Degree |
| Colville | 0.0 /100 | #317 | Tragic 29.0% |
| Yaqui | 0.0 /100 | #318 | Tragic 29.0% |
| Creek | 0.0 /100 | #319 | Tragic 28.9% |
| Kiowa | 0.0 /100 | #320 | Tragic 28.8% |
| Alaskan Athabascans | 0.0 /100 | #321 | Tragic 28.8% |
| Tsimshian | 0.0 /100 | #322 | Tragic 28.8% |
| Fijians | 0.0 /100 | #323 | Tragic 28.7% |
| Dutch West Indians | 0.0 /100 | #324 | Tragic 28.5% |
| Pennsylvania Germans | 0.0 /100 | #325 | Tragic 28.4% |
| Apache | 0.0 /100 | #326 | Tragic 28.3% |
| Paiute | 0.0 /100 | #327 | Tragic 28.1% |
| Crow | 0.0 /100 | #328 | Tragic 27.7% |
| Immigrants | Central America | 0.0 /100 | #329 | Tragic 27.5% |
| Spanish American Indians | 0.0 /100 | #330 | Tragic 27.5% |
| Immigrants | Azores | 0.0 /100 | #331 | Tragic 27.3% |
Demographics Similar to Immigrants from Japan by Bachelor's Degree
In terms of bachelor's degree, the demographic groups most similar to Immigrants from Japan are Burmese (46.9%, a difference of 0.10%), Immigrants from Korea (47.0%, a difference of 0.33%), Immigrants from Sweden (47.0%, a difference of 0.37%), Immigrants from Belgium (47.0%, a difference of 0.46%), and Immigrants from Ireland (47.1%, a difference of 0.66%).
| Demographics | Rating | Rank | Bachelor's Degree |
| Cambodians | 100.0 /100 | #19 | Exceptional 47.2% |
| Immigrants | Switzerland | 100.0 /100 | #20 | Exceptional 47.1% |
| Immigrants | Ireland | 100.0 /100 | #21 | Exceptional 47.1% |
| Immigrants | Belgium | 100.0 /100 | #22 | Exceptional 47.0% |
| Immigrants | Sweden | 100.0 /100 | #23 | Exceptional 47.0% |
| Immigrants | Korea | 100.0 /100 | #24 | Exceptional 47.0% |
| Burmese | 100.0 /100 | #25 | Exceptional 46.9% |
| Immigrants | Japan | 100.0 /100 | #26 | Exceptional 46.8% |
| Immigrants | France | 100.0 /100 | #27 | Exceptional 46.4% |
| Turks | 100.0 /100 | #28 | Exceptional 46.2% |
| Israelis | 100.0 /100 | #29 | Exceptional 46.1% |
| Immigrants | Sri Lanka | 100.0 /100 | #30 | Exceptional 46.1% |
| Latvians | 100.0 /100 | #31 | Exceptional 46.1% |
| Immigrants | Turkey | 100.0 /100 | #32 | Exceptional 46.0% |
| Immigrants | Northern Europe | 100.0 /100 | #33 | Exceptional 45.6% |