Immigrants from Hungary vs Vietnamese 7th Grade
COMPARE
Immigrants from Hungary
Vietnamese
7th Grade
7th Grade Comparison
Immigrants from Hungary
Vietnamese
96.4%
7TH GRADE
90.6/ 100
METRIC RATING
136th/ 347
METRIC RANK
93.9%
7TH GRADE
0.0/ 100
METRIC RATING
315th/ 347
METRIC RANK
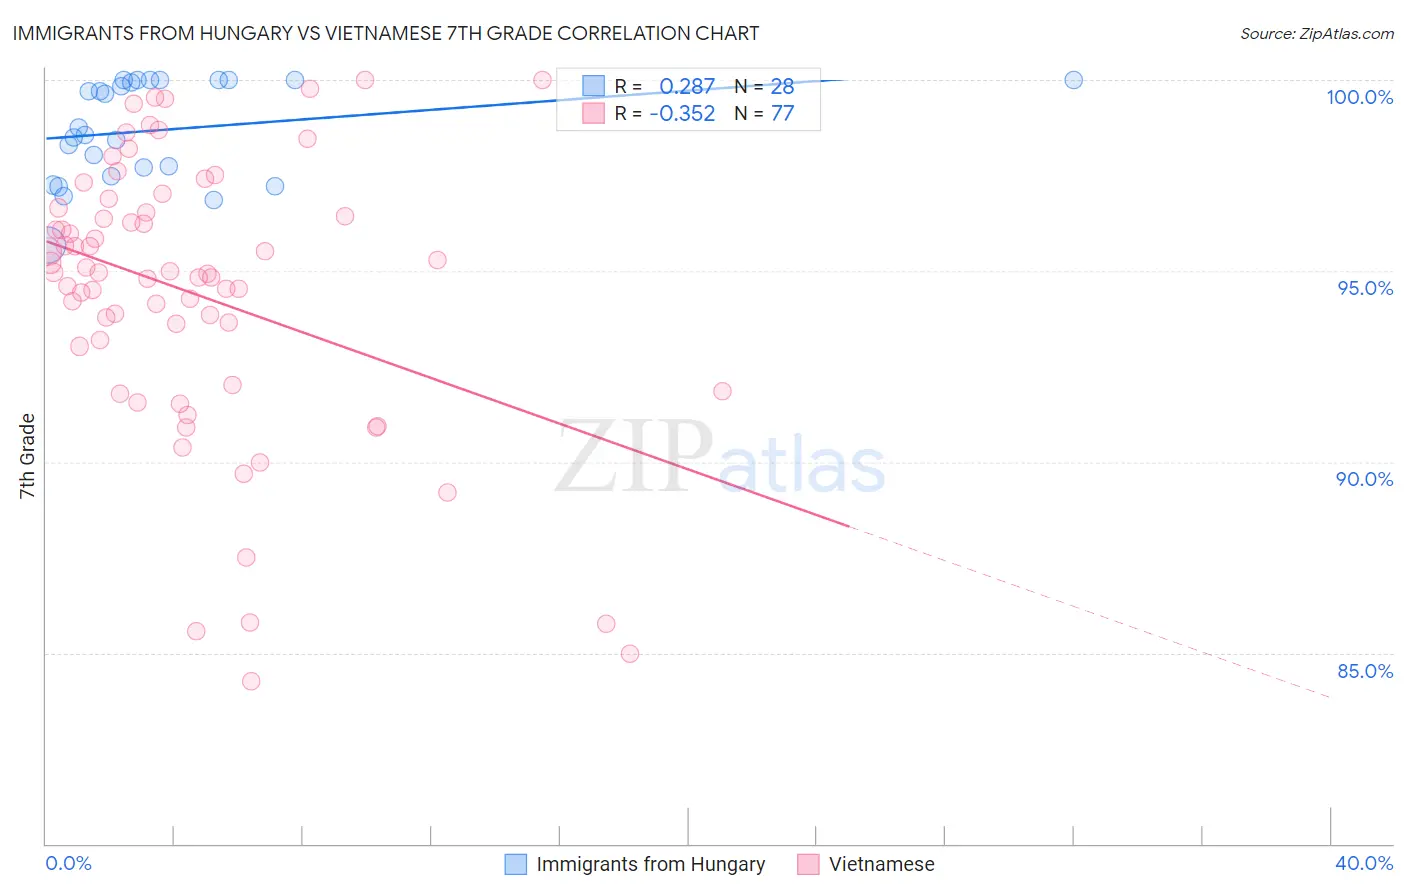
Immigrants from Hungary vs Vietnamese 7th Grade Correlation Chart
The statistical analysis conducted on geographies consisting of 195,707,305 people shows a weak positive correlation between the proportion of Immigrants from Hungary and percentage of population with at least 7th grade education in the United States with a correlation coefficient (R) of 0.287 and weighted average of 96.4%. Similarly, the statistical analysis conducted on geographies consisting of 170,728,240 people shows a mild negative correlation between the proportion of Vietnamese and percentage of population with at least 7th grade education in the United States with a correlation coefficient (R) of -0.352 and weighted average of 93.9%, a difference of 2.6%.
7th Grade Correlation Summary
| Measurement | Immigrants from Hungary | Vietnamese |
| Minimum | 95.7% | 84.3% |
| Maximum | 100.0% | 100.0% |
| Range | 4.3% | 15.7% |
| Mean | 98.7% | 94.4% |
| Median | 98.7% | 95.0% |
| Interquartile 25% (IQ1) | 97.6% | 92.5% |
| Interquartile 75% (IQ3) | 100.0% | 96.6% |
| Interquartile Range (IQR) | 2.4% | 4.1% |
| Standard Deviation (Sample) | 1.3% | 3.6% |
| Standard Deviation (Population) | 1.3% | 3.6% |
Similar Demographics by 7th Grade
Demographics Similar to Immigrants from Hungary by 7th Grade
In terms of 7th grade, the demographic groups most similar to Immigrants from Hungary are Soviet Union (96.4%, a difference of 0.010%), Immigrants from Kuwait (96.4%, a difference of 0.010%), Immigrants from Turkey (96.4%, a difference of 0.010%), Jordanian (96.4%, a difference of 0.010%), and Colville (96.4%, a difference of 0.020%).
| Demographics | Rating | Rank | 7th Grade |
| Immigrants | North Macedonia | 93.1 /100 | #129 | Exceptional 96.4% |
| Immigrants | Serbia | 92.8 /100 | #130 | Exceptional 96.4% |
| Filipinos | 92.1 /100 | #131 | Exceptional 96.4% |
| Colville | 91.7 /100 | #132 | Exceptional 96.4% |
| Hmong | 91.5 /100 | #133 | Exceptional 96.4% |
| Soviet Union | 91.2 /100 | #134 | Exceptional 96.4% |
| Immigrants | Kuwait | 91.1 /100 | #135 | Exceptional 96.4% |
| Immigrants | Hungary | 90.6 /100 | #136 | Exceptional 96.4% |
| Immigrants | Turkey | 90.2 /100 | #137 | Exceptional 96.4% |
| Jordanians | 90.0 /100 | #138 | Excellent 96.4% |
| Basques | 89.3 /100 | #139 | Excellent 96.4% |
| Cambodians | 88.3 /100 | #140 | Excellent 96.3% |
| Immigrants | South Central Asia | 87.1 /100 | #141 | Excellent 96.3% |
| Burmese | 87.1 /100 | #142 | Excellent 96.3% |
| Spanish | 86.6 /100 | #143 | Excellent 96.3% |
Demographics Similar to Vietnamese by 7th Grade
In terms of 7th grade, the demographic groups most similar to Vietnamese are Immigrants from Vietnam (93.9%, a difference of 0.030%), Japanese (94.0%, a difference of 0.050%), Immigrants from Bangladesh (94.0%, a difference of 0.080%), Immigrants (94.0%, a difference of 0.090%), and Immigrants from Cuba (93.8%, a difference of 0.11%).
| Demographics | Rating | Rank | 7th Grade |
| Cape Verdeans | 0.0 /100 | #308 | Tragic 94.1% |
| Ecuadorians | 0.0 /100 | #309 | Tragic 94.0% |
| Immigrants | Caribbean | 0.0 /100 | #310 | Tragic 94.0% |
| Puerto Ricans | 0.0 /100 | #311 | Tragic 94.0% |
| Immigrants | Immigrants | 0.0 /100 | #312 | Tragic 94.0% |
| Immigrants | Bangladesh | 0.0 /100 | #313 | Tragic 94.0% |
| Japanese | 0.0 /100 | #314 | Tragic 94.0% |
| Vietnamese | 0.0 /100 | #315 | Tragic 93.9% |
| Immigrants | Vietnam | 0.0 /100 | #316 | Tragic 93.9% |
| Immigrants | Cuba | 0.0 /100 | #317 | Tragic 93.8% |
| Immigrants | Ecuador | 0.0 /100 | #318 | Tragic 93.7% |
| Immigrants | Cambodia | 0.0 /100 | #319 | Tragic 93.7% |
| Immigrants | Fiji | 0.0 /100 | #320 | Tragic 93.5% |
| Belizeans | 0.0 /100 | #321 | Tragic 93.5% |
| Nicaraguans | 0.0 /100 | #322 | Tragic 93.5% |