Immigrants from Hungary vs Canadian 7th Grade
COMPARE
Immigrants from Hungary
Canadian
7th Grade
7th Grade Comparison
Immigrants from Hungary
Canadians
96.4%
7TH GRADE
90.6/ 100
METRIC RATING
136th/ 347
METRIC RANK
96.9%
7TH GRADE
99.7/ 100
METRIC RATING
65th/ 347
METRIC RANK
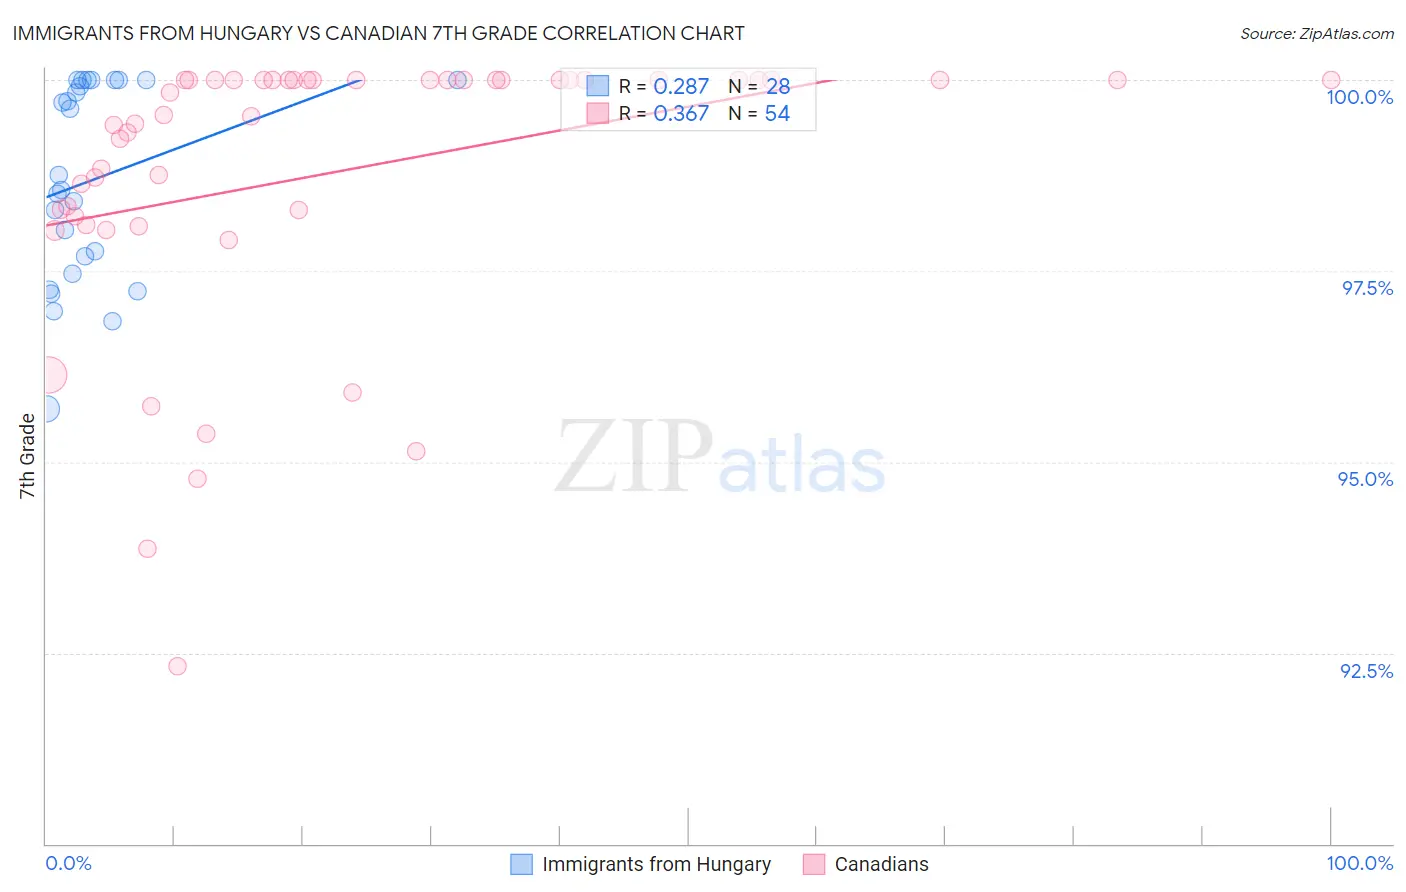
Immigrants from Hungary vs Canadian 7th Grade Correlation Chart
The statistical analysis conducted on geographies consisting of 195,707,305 people shows a weak positive correlation between the proportion of Immigrants from Hungary and percentage of population with at least 7th grade education in the United States with a correlation coefficient (R) of 0.287 and weighted average of 96.4%. Similarly, the statistical analysis conducted on geographies consisting of 437,556,929 people shows a mild positive correlation between the proportion of Canadians and percentage of population with at least 7th grade education in the United States with a correlation coefficient (R) of 0.367 and weighted average of 96.9%, a difference of 0.55%.
7th Grade Correlation Summary
| Measurement | Immigrants from Hungary | Canadian |
| Minimum | 95.7% | 92.3% |
| Maximum | 100.0% | 100.0% |
| Range | 4.3% | 7.7% |
| Mean | 98.7% | 98.8% |
| Median | 98.7% | 99.7% |
| Interquartile 25% (IQ1) | 97.6% | 98.2% |
| Interquartile 75% (IQ3) | 100.0% | 100.0% |
| Interquartile Range (IQR) | 2.4% | 1.8% |
| Standard Deviation (Sample) | 1.3% | 1.8% |
| Standard Deviation (Population) | 1.3% | 1.8% |
Similar Demographics by 7th Grade
Demographics Similar to Immigrants from Hungary by 7th Grade
In terms of 7th grade, the demographic groups most similar to Immigrants from Hungary are Soviet Union (96.4%, a difference of 0.010%), Immigrants from Kuwait (96.4%, a difference of 0.010%), Immigrants from Turkey (96.4%, a difference of 0.010%), Jordanian (96.4%, a difference of 0.010%), and Colville (96.4%, a difference of 0.020%).
| Demographics | Rating | Rank | 7th Grade |
| Immigrants | North Macedonia | 93.1 /100 | #129 | Exceptional 96.4% |
| Immigrants | Serbia | 92.8 /100 | #130 | Exceptional 96.4% |
| Filipinos | 92.1 /100 | #131 | Exceptional 96.4% |
| Colville | 91.7 /100 | #132 | Exceptional 96.4% |
| Hmong | 91.5 /100 | #133 | Exceptional 96.4% |
| Soviet Union | 91.2 /100 | #134 | Exceptional 96.4% |
| Immigrants | Kuwait | 91.1 /100 | #135 | Exceptional 96.4% |
| Immigrants | Hungary | 90.6 /100 | #136 | Exceptional 96.4% |
| Immigrants | Turkey | 90.2 /100 | #137 | Exceptional 96.4% |
| Jordanians | 90.0 /100 | #138 | Excellent 96.4% |
| Basques | 89.3 /100 | #139 | Excellent 96.4% |
| Cambodians | 88.3 /100 | #140 | Excellent 96.3% |
| Immigrants | South Central Asia | 87.1 /100 | #141 | Excellent 96.3% |
| Burmese | 87.1 /100 | #142 | Excellent 96.3% |
| Spanish | 86.6 /100 | #143 | Excellent 96.3% |
Demographics Similar to Canadians by 7th Grade
In terms of 7th grade, the demographic groups most similar to Canadians are Immigrants from Northern Europe (96.9%, a difference of 0.010%), Immigrants from Austria (96.9%, a difference of 0.010%), Ukrainian (96.9%, a difference of 0.020%), Native Hawaiian (96.9%, a difference of 0.020%), and Creek (96.9%, a difference of 0.030%).
| Demographics | Rating | Rank | 7th Grade |
| Whites/Caucasians | 99.8 /100 | #58 | Exceptional 97.0% |
| Macedonians | 99.8 /100 | #59 | Exceptional 97.0% |
| Immigrants | Canada | 99.8 /100 | #60 | Exceptional 96.9% |
| Creek | 99.8 /100 | #61 | Exceptional 96.9% |
| Immigrants | North America | 99.8 /100 | #62 | Exceptional 96.9% |
| Immigrants | Northern Europe | 99.7 /100 | #63 | Exceptional 96.9% |
| Immigrants | Austria | 99.7 /100 | #64 | Exceptional 96.9% |
| Canadians | 99.7 /100 | #65 | Exceptional 96.9% |
| Ukrainians | 99.7 /100 | #66 | Exceptional 96.9% |
| Native Hawaiians | 99.7 /100 | #67 | Exceptional 96.9% |
| Immigrants | India | 99.6 /100 | #68 | Exceptional 96.9% |
| Iranians | 99.6 /100 | #69 | Exceptional 96.8% |
| New Zealanders | 99.6 /100 | #70 | Exceptional 96.8% |
| Immigrants | Lithuania | 99.6 /100 | #71 | Exceptional 96.8% |
| Cajuns | 99.5 /100 | #72 | Exceptional 96.8% |