Immigrants from Haiti vs Lithuanian Kindergarten
COMPARE
Immigrants from Haiti
Lithuanian
Kindergarten
Kindergarten Comparison
Immigrants from Haiti
Lithuanians
97.0%
KINDERGARTEN
0.0/ 100
METRIC RATING
309th/ 347
METRIC RANK
98.6%
KINDERGARTEN
100.0/ 100
METRIC RATING
21st/ 347
METRIC RANK
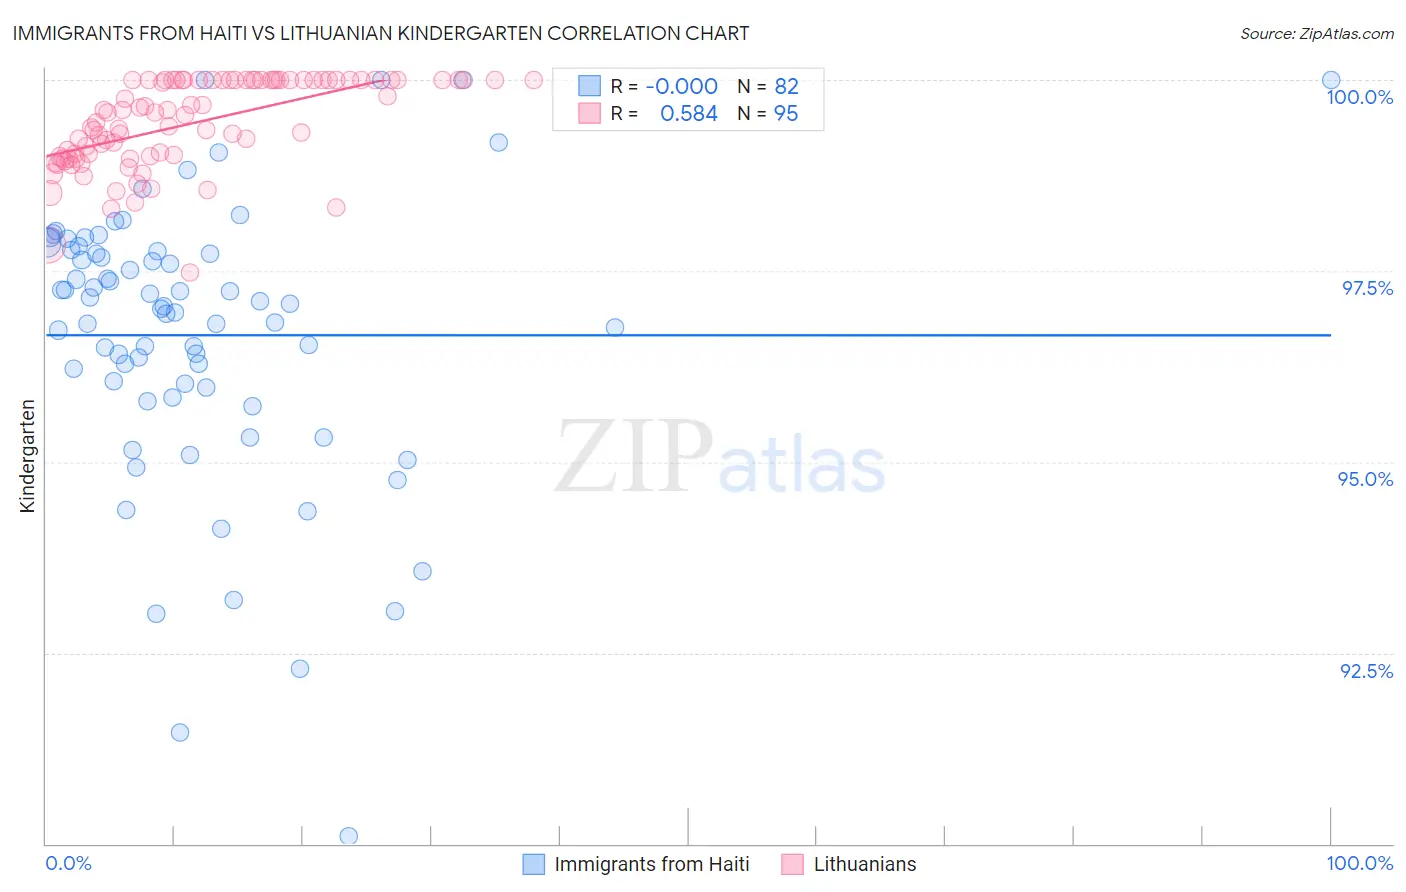
Immigrants from Haiti vs Lithuanian Kindergarten Correlation Chart
The statistical analysis conducted on geographies consisting of 225,286,614 people shows no correlation between the proportion of Immigrants from Haiti and percentage of population with at least kindergarten education in the United States with a correlation coefficient (R) of -0.000 and weighted average of 97.0%. Similarly, the statistical analysis conducted on geographies consisting of 421,946,231 people shows a substantial positive correlation between the proportion of Lithuanians and percentage of population with at least kindergarten education in the United States with a correlation coefficient (R) of 0.584 and weighted average of 98.6%, a difference of 1.7%.
Kindergarten Correlation Summary
| Measurement | Immigrants from Haiti | Lithuanian |
| Minimum | 90.1% | 97.5% |
| Maximum | 100.0% | 100.0% |
| Range | 9.9% | 2.5% |
| Mean | 96.7% | 99.4% |
| Median | 97.0% | 99.6% |
| Interquartile 25% (IQ1) | 96.0% | 99.0% |
| Interquartile 75% (IQ3) | 97.8% | 100.0% |
| Interquartile Range (IQR) | 1.8% | 1.0% |
| Standard Deviation (Sample) | 1.8% | 0.58% |
| Standard Deviation (Population) | 1.8% | 0.58% |
Similar Demographics by Kindergarten
Demographics Similar to Immigrants from Haiti by Kindergarten
In terms of kindergarten, the demographic groups most similar to Immigrants from Haiti are Immigrants from Somalia (97.0%, a difference of 0.0%), Immigrants from the Azores (97.0%, a difference of 0.0%), Hispanic or Latino (97.0%, a difference of 0.010%), Sri Lankan (97.0%, a difference of 0.010%), and Belizean (97.0%, a difference of 0.020%).
| Demographics | Rating | Rank | Kindergarten |
| Immigrants | Caribbean | 0.0 /100 | #302 | Tragic 97.1% |
| Somalis | 0.0 /100 | #303 | Tragic 97.0% |
| Nicaraguans | 0.0 /100 | #304 | Tragic 97.0% |
| Ecuadorians | 0.0 /100 | #305 | Tragic 97.0% |
| Belizeans | 0.0 /100 | #306 | Tragic 97.0% |
| Hispanics or Latinos | 0.0 /100 | #307 | Tragic 97.0% |
| Immigrants | Somalia | 0.0 /100 | #308 | Tragic 97.0% |
| Immigrants | Haiti | 0.0 /100 | #309 | Tragic 97.0% |
| Immigrants | Azores | 0.0 /100 | #310 | Tragic 97.0% |
| Sri Lankans | 0.0 /100 | #311 | Tragic 97.0% |
| Guyanese | 0.0 /100 | #312 | Tragic 96.9% |
| Cape Verdeans | 0.0 /100 | #313 | Tragic 96.9% |
| Hondurans | 0.0 /100 | #314 | Tragic 96.9% |
| Immigrants | Belize | 0.0 /100 | #315 | Tragic 96.9% |
| Immigrants | Nicaragua | 0.0 /100 | #316 | Tragic 96.9% |
Demographics Similar to Lithuanians by Kindergarten
In terms of kindergarten, the demographic groups most similar to Lithuanians are Pennsylvania German (98.6%, a difference of 0.0%), Finnish (98.6%, a difference of 0.0%), Arapaho (98.6%, a difference of 0.0%), Danish (98.6%, a difference of 0.0%), and Sioux (98.6%, a difference of 0.0%).
| Demographics | Rating | Rank | Kindergarten |
| English | 100.0 /100 | #14 | Exceptional 98.7% |
| Swedes | 100.0 /100 | #15 | Exceptional 98.7% |
| Aleuts | 100.0 /100 | #16 | Exceptional 98.6% |
| Scottish | 100.0 /100 | #17 | Exceptional 98.6% |
| Dutch | 100.0 /100 | #18 | Exceptional 98.6% |
| Irish | 100.0 /100 | #19 | Exceptional 98.6% |
| Pennsylvania Germans | 100.0 /100 | #20 | Exceptional 98.6% |
| Lithuanians | 100.0 /100 | #21 | Exceptional 98.6% |
| Finns | 100.0 /100 | #22 | Exceptional 98.6% |
| Arapaho | 100.0 /100 | #23 | Exceptional 98.6% |
| Danes | 100.0 /100 | #24 | Exceptional 98.6% |
| Sioux | 100.0 /100 | #25 | Exceptional 98.6% |
| Poles | 100.0 /100 | #26 | Exceptional 98.6% |
| Scotch-Irish | 100.0 /100 | #27 | Exceptional 98.6% |
| Croatians | 100.0 /100 | #28 | Exceptional 98.6% |