Immigrants from Haiti vs Immigrants from Ethiopia Kindergarten
COMPARE
Immigrants from Haiti
Immigrants from Ethiopia
Kindergarten
Kindergarten Comparison
Immigrants from Haiti
Immigrants from Ethiopia
97.0%
KINDERGARTEN
0.0/ 100
METRIC RATING
309th/ 347
METRIC RANK
97.5%
KINDERGARTEN
0.4/ 100
METRIC RATING
262nd/ 347
METRIC RANK
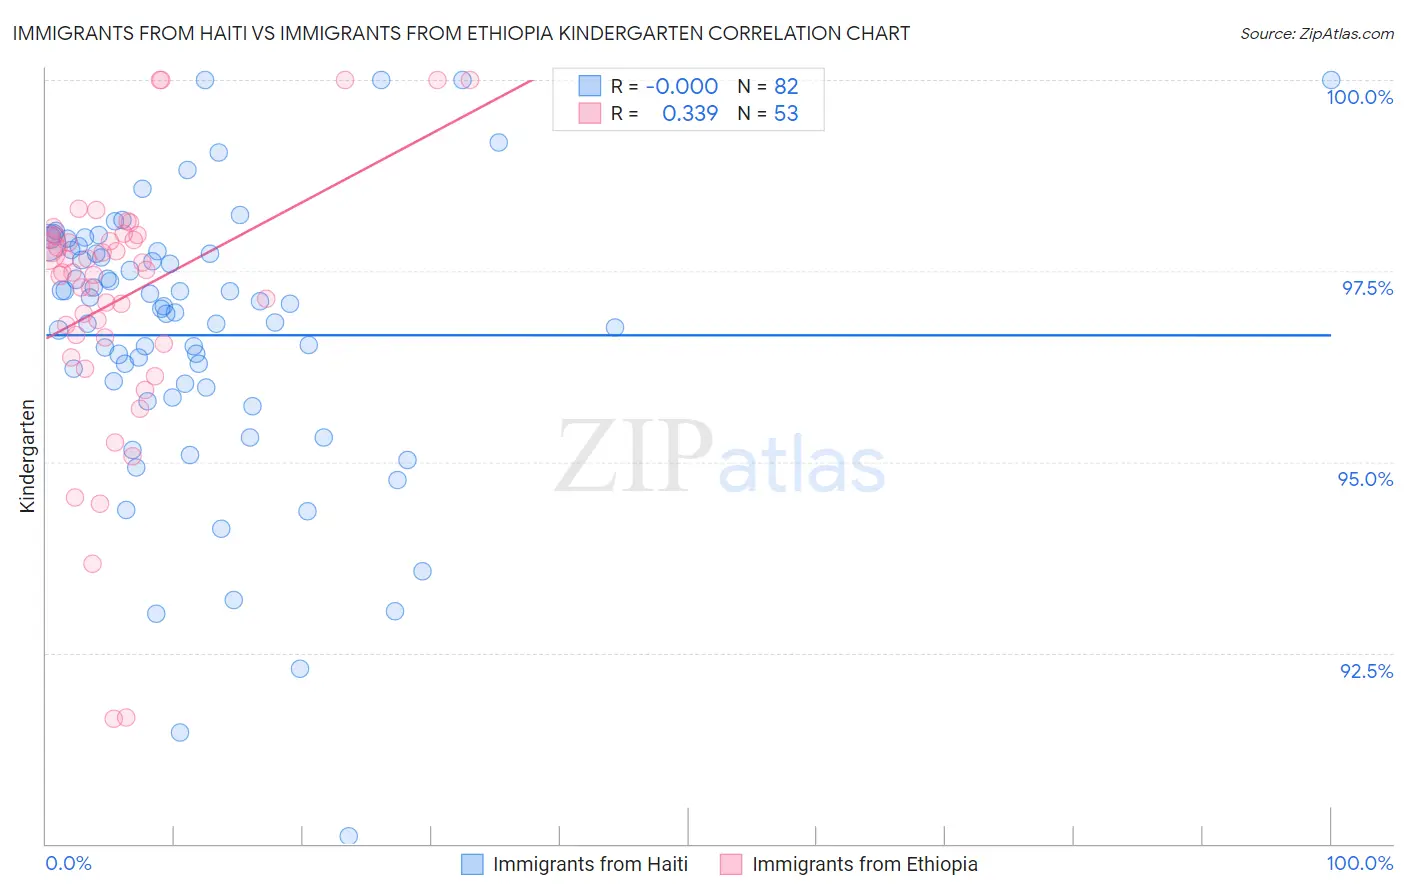
Immigrants from Haiti vs Immigrants from Ethiopia Kindergarten Correlation Chart
The statistical analysis conducted on geographies consisting of 225,286,614 people shows no correlation between the proportion of Immigrants from Haiti and percentage of population with at least kindergarten education in the United States with a correlation coefficient (R) of -0.000 and weighted average of 97.0%. Similarly, the statistical analysis conducted on geographies consisting of 211,539,400 people shows a mild positive correlation between the proportion of Immigrants from Ethiopia and percentage of population with at least kindergarten education in the United States with a correlation coefficient (R) of 0.339 and weighted average of 97.5%, a difference of 0.60%.
Kindergarten Correlation Summary
| Measurement | Immigrants from Haiti | Immigrants from Ethiopia |
| Minimum | 90.1% | 91.6% |
| Maximum | 100.0% | 100.0% |
| Range | 9.9% | 8.4% |
| Mean | 96.7% | 97.1% |
| Median | 97.0% | 97.5% |
| Interquartile 25% (IQ1) | 96.0% | 96.6% |
| Interquartile 75% (IQ3) | 97.8% | 98.0% |
| Interquartile Range (IQR) | 1.8% | 1.4% |
| Standard Deviation (Sample) | 1.8% | 1.7% |
| Standard Deviation (Population) | 1.8% | 1.7% |
Similar Demographics by Kindergarten
Demographics Similar to Immigrants from Haiti by Kindergarten
In terms of kindergarten, the demographic groups most similar to Immigrants from Haiti are Immigrants from Somalia (97.0%, a difference of 0.0%), Immigrants from the Azores (97.0%, a difference of 0.0%), Hispanic or Latino (97.0%, a difference of 0.010%), Sri Lankan (97.0%, a difference of 0.010%), and Belizean (97.0%, a difference of 0.020%).
| Demographics | Rating | Rank | Kindergarten |
| Immigrants | Caribbean | 0.0 /100 | #302 | Tragic 97.1% |
| Somalis | 0.0 /100 | #303 | Tragic 97.0% |
| Nicaraguans | 0.0 /100 | #304 | Tragic 97.0% |
| Ecuadorians | 0.0 /100 | #305 | Tragic 97.0% |
| Belizeans | 0.0 /100 | #306 | Tragic 97.0% |
| Hispanics or Latinos | 0.0 /100 | #307 | Tragic 97.0% |
| Immigrants | Somalia | 0.0 /100 | #308 | Tragic 97.0% |
| Immigrants | Haiti | 0.0 /100 | #309 | Tragic 97.0% |
| Immigrants | Azores | 0.0 /100 | #310 | Tragic 97.0% |
| Sri Lankans | 0.0 /100 | #311 | Tragic 97.0% |
| Guyanese | 0.0 /100 | #312 | Tragic 96.9% |
| Cape Verdeans | 0.0 /100 | #313 | Tragic 96.9% |
| Hondurans | 0.0 /100 | #314 | Tragic 96.9% |
| Immigrants | Belize | 0.0 /100 | #315 | Tragic 96.9% |
| Immigrants | Nicaragua | 0.0 /100 | #316 | Tragic 96.9% |
Demographics Similar to Immigrants from Ethiopia by Kindergarten
In terms of kindergarten, the demographic groups most similar to Immigrants from Ethiopia are Taiwanese (97.5%, a difference of 0.0%), Immigrants from South America (97.5%, a difference of 0.0%), Assyrian/Chaldean/Syriac (97.5%, a difference of 0.0%), Armenian (97.6%, a difference of 0.010%), and Fijian (97.5%, a difference of 0.010%).
| Demographics | Rating | Rank | Kindergarten |
| Immigrants | Congo | 0.8 /100 | #255 | Tragic 97.6% |
| Yaqui | 0.7 /100 | #256 | Tragic 97.6% |
| Immigrants | Colombia | 0.6 /100 | #257 | Tragic 97.6% |
| Jamaicans | 0.6 /100 | #258 | Tragic 97.6% |
| Armenians | 0.5 /100 | #259 | Tragic 97.6% |
| Fijians | 0.5 /100 | #260 | Tragic 97.5% |
| Taiwanese | 0.4 /100 | #261 | Tragic 97.5% |
| Immigrants | Ethiopia | 0.4 /100 | #262 | Tragic 97.5% |
| Immigrants | South America | 0.4 /100 | #263 | Tragic 97.5% |
| Assyrians/Chaldeans/Syriacs | 0.4 /100 | #264 | Tragic 97.5% |
| Cubans | 0.3 /100 | #265 | Tragic 97.5% |
| Immigrants | Sierra Leone | 0.3 /100 | #266 | Tragic 97.5% |
| Immigrants | Liberia | 0.3 /100 | #267 | Tragic 97.5% |
| Immigrants | Nigeria | 0.3 /100 | #268 | Tragic 97.5% |
| West Indians | 0.3 /100 | #269 | Tragic 97.5% |