Immigrants from Guyana vs Celtic 10th Grade
COMPARE
Immigrants from Guyana
Celtic
10th Grade
10th Grade Comparison
Immigrants from Guyana
Celtics
91.2%
10TH GRADE
0.0/ 100
METRIC RATING
302nd/ 347
METRIC RANK
95.0%
10TH GRADE
99.8/ 100
METRIC RATING
59th/ 347
METRIC RANK
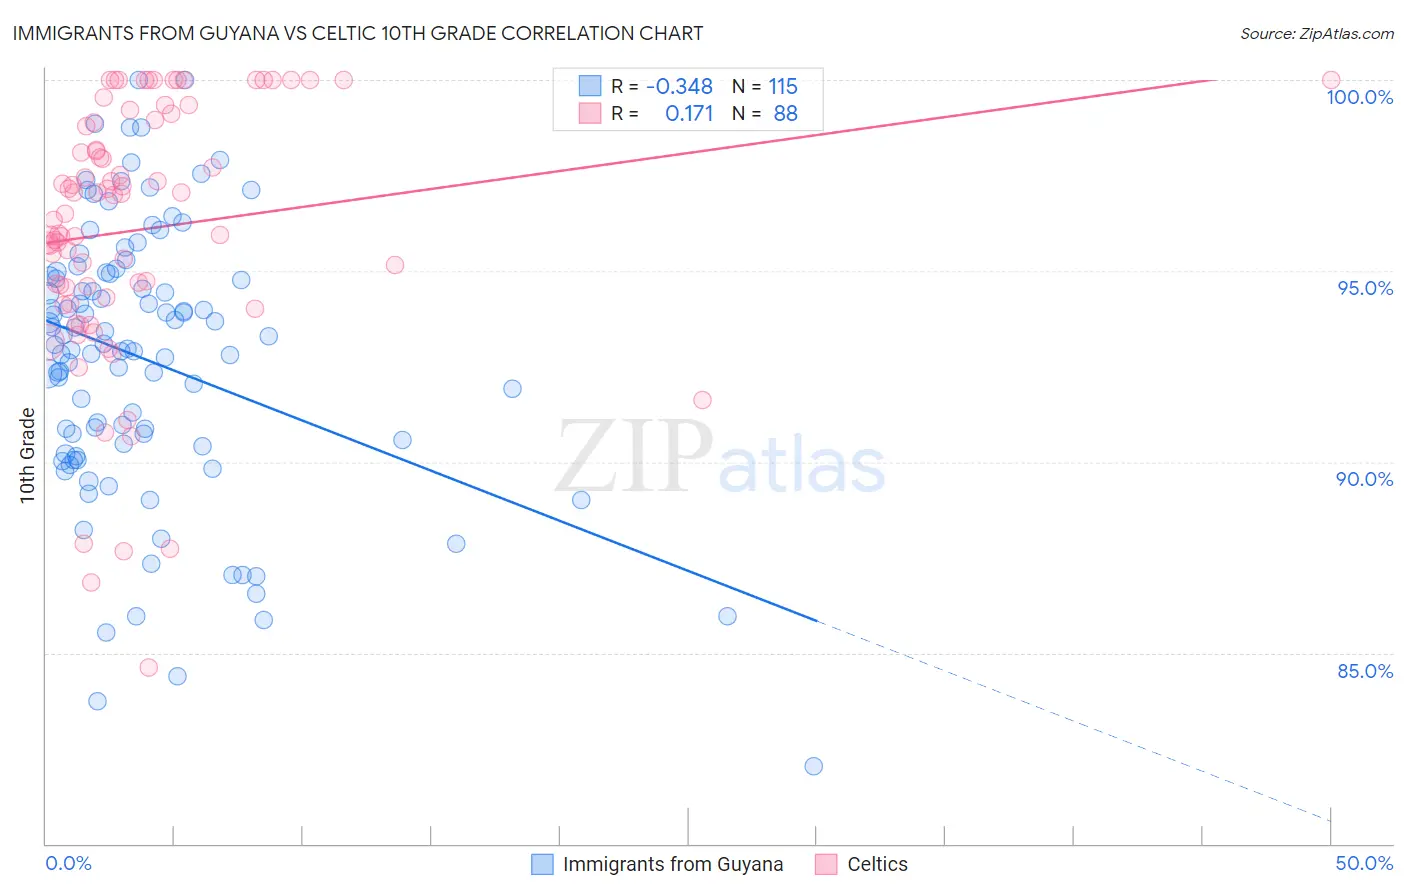
Immigrants from Guyana vs Celtic 10th Grade Correlation Chart
The statistical analysis conducted on geographies consisting of 183,673,461 people shows a mild negative correlation between the proportion of Immigrants from Guyana and percentage of population with at least 10th grade education in the United States with a correlation coefficient (R) of -0.348 and weighted average of 91.2%. Similarly, the statistical analysis conducted on geographies consisting of 168,876,981 people shows a poor positive correlation between the proportion of Celtics and percentage of population with at least 10th grade education in the United States with a correlation coefficient (R) of 0.171 and weighted average of 95.0%, a difference of 4.2%.
10th Grade Correlation Summary
| Measurement | Immigrants from Guyana | Celtic |
| Minimum | 82.0% | 84.6% |
| Maximum | 100.0% | 100.0% |
| Range | 18.0% | 15.4% |
| Mean | 92.7% | 96.1% |
| Median | 93.1% | 96.8% |
| Interquartile 25% (IQ1) | 90.4% | 94.4% |
| Interquartile 75% (IQ3) | 94.9% | 98.9% |
| Interquartile Range (IQR) | 4.5% | 4.5% |
| Standard Deviation (Sample) | 3.6% | 3.4% |
| Standard Deviation (Population) | 3.6% | 3.4% |
Similar Demographics by 10th Grade
Demographics Similar to Immigrants from Guyana by 10th Grade
In terms of 10th grade, the demographic groups most similar to Immigrants from Guyana are Japanese (91.2%, a difference of 0.010%), Immigrants from Vietnam (91.2%, a difference of 0.020%), Pima (91.2%, a difference of 0.080%), Immigrants from Dominica (91.1%, a difference of 0.090%), and Yaqui (91.1%, a difference of 0.15%).
| Demographics | Rating | Rank | 10th Grade |
| Lumbee | 0.0 /100 | #295 | Tragic 91.7% |
| Immigrants | Grenada | 0.0 /100 | #296 | Tragic 91.6% |
| Fijians | 0.0 /100 | #297 | Tragic 91.5% |
| Cubans | 0.0 /100 | #298 | Tragic 91.5% |
| Immigrants | Haiti | 0.0 /100 | #299 | Tragic 91.4% |
| Guyanese | 0.0 /100 | #300 | Tragic 91.4% |
| Japanese | 0.0 /100 | #301 | Tragic 91.2% |
| Immigrants | Guyana | 0.0 /100 | #302 | Tragic 91.2% |
| Immigrants | Vietnam | 0.0 /100 | #303 | Tragic 91.2% |
| Pima | 0.0 /100 | #304 | Tragic 91.2% |
| Immigrants | Dominica | 0.0 /100 | #305 | Tragic 91.1% |
| Yaqui | 0.0 /100 | #306 | Tragic 91.1% |
| Immigrants | Fiji | 0.0 /100 | #307 | Tragic 91.0% |
| Immigrants | Bangladesh | 0.0 /100 | #308 | Tragic 91.0% |
| Immigrants | Immigrants | 0.0 /100 | #309 | Tragic 91.0% |
Demographics Similar to Celtics by 10th Grade
In terms of 10th grade, the demographic groups most similar to Celtics are Aleut (95.0%, a difference of 0.0%), Immigrants from Ireland (95.0%, a difference of 0.010%), New Zealander (95.0%, a difference of 0.010%), Ukrainian (95.0%, a difference of 0.010%), and Cypriot (95.0%, a difference of 0.010%).
| Demographics | Rating | Rank | 10th Grade |
| Ottawa | 99.8 /100 | #52 | Exceptional 95.1% |
| Immigrants | North America | 99.8 /100 | #53 | Exceptional 95.0% |
| Immigrants | Lithuania | 99.8 /100 | #54 | Exceptional 95.0% |
| Immigrants | Ireland | 99.8 /100 | #55 | Exceptional 95.0% |
| New Zealanders | 99.8 /100 | #56 | Exceptional 95.0% |
| Ukrainians | 99.8 /100 | #57 | Exceptional 95.0% |
| Aleuts | 99.8 /100 | #58 | Exceptional 95.0% |
| Celtics | 99.8 /100 | #59 | Exceptional 95.0% |
| Cypriots | 99.8 /100 | #60 | Exceptional 95.0% |
| Chippewa | 99.8 /100 | #61 | Exceptional 95.0% |
| Thais | 99.8 /100 | #62 | Exceptional 95.0% |
| Immigrants | Singapore | 99.8 /100 | #63 | Exceptional 95.0% |
| Native Hawaiians | 99.7 /100 | #64 | Exceptional 95.0% |
| Turks | 99.7 /100 | #65 | Exceptional 95.0% |
| Immigrants | Australia | 99.7 /100 | #66 | Exceptional 94.9% |