Immigrants from Guyana vs Burmese 10th Grade
COMPARE
Immigrants from Guyana
Burmese
10th Grade
10th Grade Comparison
Immigrants from Guyana
Burmese
91.2%
10TH GRADE
0.0/ 100
METRIC RATING
302nd/ 347
METRIC RANK
94.5%
10TH GRADE
97.1/ 100
METRIC RATING
110th/ 347
METRIC RANK
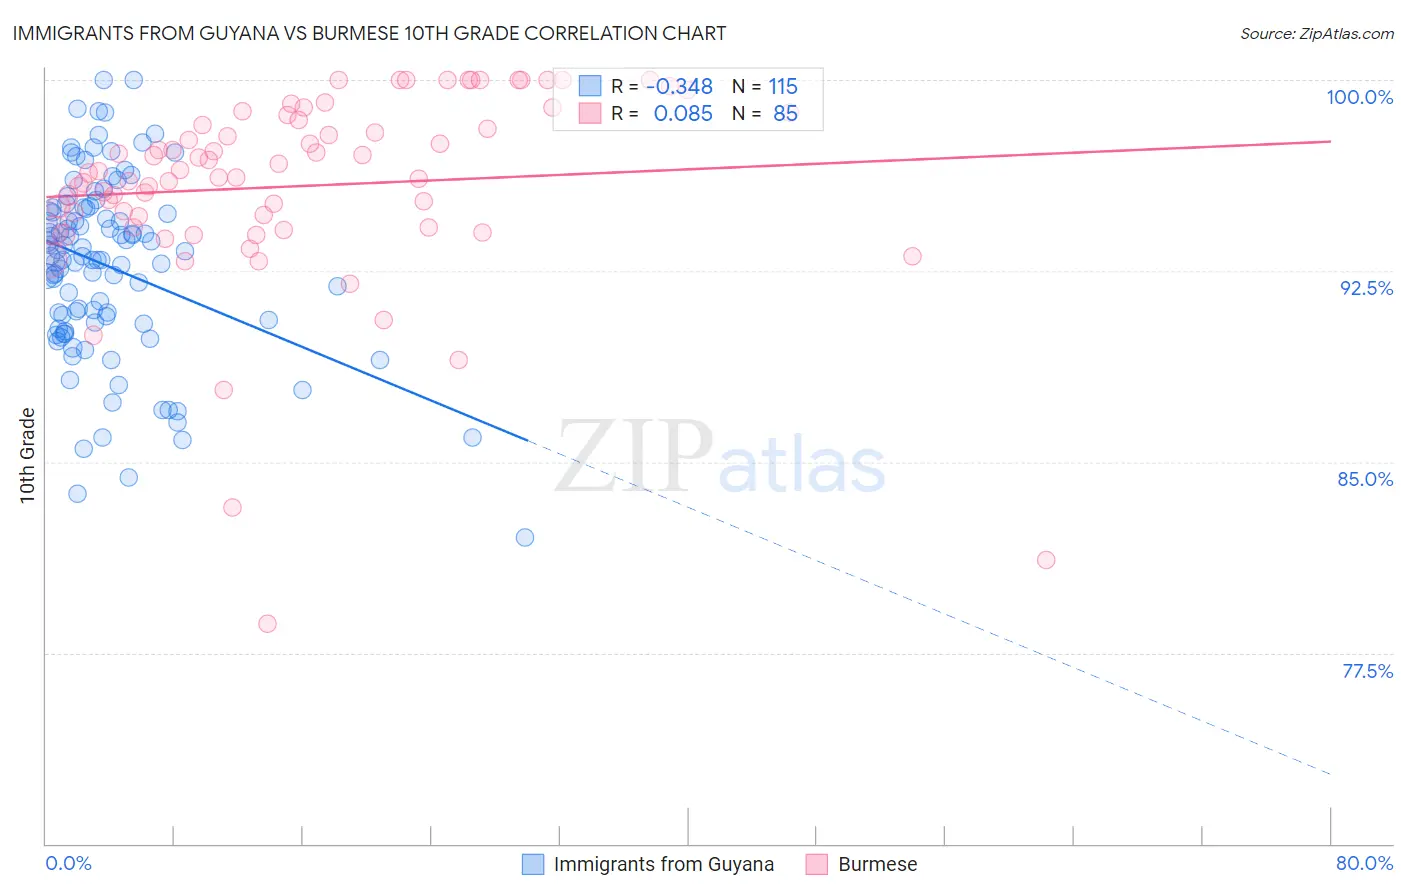
Immigrants from Guyana vs Burmese 10th Grade Correlation Chart
The statistical analysis conducted on geographies consisting of 183,673,461 people shows a mild negative correlation between the proportion of Immigrants from Guyana and percentage of population with at least 10th grade education in the United States with a correlation coefficient (R) of -0.348 and weighted average of 91.2%. Similarly, the statistical analysis conducted on geographies consisting of 465,370,495 people shows a slight positive correlation between the proportion of Burmese and percentage of population with at least 10th grade education in the United States with a correlation coefficient (R) of 0.085 and weighted average of 94.5%, a difference of 3.6%.
10th Grade Correlation Summary
| Measurement | Immigrants from Guyana | Burmese |
| Minimum | 82.0% | 78.7% |
| Maximum | 100.0% | 100.0% |
| Range | 18.0% | 21.3% |
| Mean | 92.7% | 95.8% |
| Median | 93.1% | 96.4% |
| Interquartile 25% (IQ1) | 90.4% | 94.2% |
| Interquartile 75% (IQ3) | 94.9% | 98.5% |
| Interquartile Range (IQR) | 4.5% | 4.3% |
| Standard Deviation (Sample) | 3.6% | 3.9% |
| Standard Deviation (Population) | 3.6% | 3.9% |
Similar Demographics by 10th Grade
Demographics Similar to Immigrants from Guyana by 10th Grade
In terms of 10th grade, the demographic groups most similar to Immigrants from Guyana are Japanese (91.2%, a difference of 0.010%), Immigrants from Vietnam (91.2%, a difference of 0.020%), Pima (91.2%, a difference of 0.080%), Immigrants from Dominica (91.1%, a difference of 0.090%), and Yaqui (91.1%, a difference of 0.15%).
| Demographics | Rating | Rank | 10th Grade |
| Lumbee | 0.0 /100 | #295 | Tragic 91.7% |
| Immigrants | Grenada | 0.0 /100 | #296 | Tragic 91.6% |
| Fijians | 0.0 /100 | #297 | Tragic 91.5% |
| Cubans | 0.0 /100 | #298 | Tragic 91.5% |
| Immigrants | Haiti | 0.0 /100 | #299 | Tragic 91.4% |
| Guyanese | 0.0 /100 | #300 | Tragic 91.4% |
| Japanese | 0.0 /100 | #301 | Tragic 91.2% |
| Immigrants | Guyana | 0.0 /100 | #302 | Tragic 91.2% |
| Immigrants | Vietnam | 0.0 /100 | #303 | Tragic 91.2% |
| Pima | 0.0 /100 | #304 | Tragic 91.2% |
| Immigrants | Dominica | 0.0 /100 | #305 | Tragic 91.1% |
| Yaqui | 0.0 /100 | #306 | Tragic 91.1% |
| Immigrants | Fiji | 0.0 /100 | #307 | Tragic 91.0% |
| Immigrants | Bangladesh | 0.0 /100 | #308 | Tragic 91.0% |
| Immigrants | Immigrants | 0.0 /100 | #309 | Tragic 91.0% |
Demographics Similar to Burmese by 10th Grade
In terms of 10th grade, the demographic groups most similar to Burmese are Immigrants from North Macedonia (94.5%, a difference of 0.010%), Immigrants from Norway (94.5%, a difference of 0.010%), Immigrants from Serbia (94.5%, a difference of 0.020%), Immigrants from Croatia (94.5%, a difference of 0.020%), and Immigrants from Zimbabwe (94.4%, a difference of 0.020%).
| Demographics | Rating | Rank | 10th Grade |
| Immigrants | Europe | 97.5 /100 | #103 | Exceptional 94.5% |
| Immigrants | Romania | 97.5 /100 | #104 | Exceptional 94.5% |
| Immigrants | Turkey | 97.4 /100 | #105 | Exceptional 94.5% |
| Immigrants | Serbia | 97.4 /100 | #106 | Exceptional 94.5% |
| Immigrants | Croatia | 97.4 /100 | #107 | Exceptional 94.5% |
| Immigrants | North Macedonia | 97.2 /100 | #108 | Exceptional 94.5% |
| Immigrants | Norway | 97.2 /100 | #109 | Exceptional 94.5% |
| Burmese | 97.1 /100 | #110 | Exceptional 94.5% |
| Immigrants | Zimbabwe | 96.8 /100 | #111 | Exceptional 94.4% |
| Immigrants | Kuwait | 96.8 /100 | #112 | Exceptional 94.4% |
| Palestinians | 96.5 /100 | #113 | Exceptional 94.4% |
| German Russians | 96.3 /100 | #114 | Exceptional 94.4% |
| Delaware | 96.3 /100 | #115 | Exceptional 94.4% |
| Sioux | 96.2 /100 | #116 | Exceptional 94.4% |
| Immigrants | Hungary | 95.8 /100 | #117 | Exceptional 94.4% |