Immigrants from Grenada vs Malaysian 12th Grade, No Diploma
COMPARE
Immigrants from Grenada
Malaysian
12th Grade, No Diploma
12th Grade, No Diploma Comparison
Immigrants from Grenada
Malaysians
88.4%
12TH GRADE, NO DIPLOMA
0.0/ 100
METRIC RATING
292nd/ 347
METRIC RANK
89.2%
12TH GRADE, NO DIPLOMA
0.1/ 100
METRIC RATING
272nd/ 347
METRIC RANK
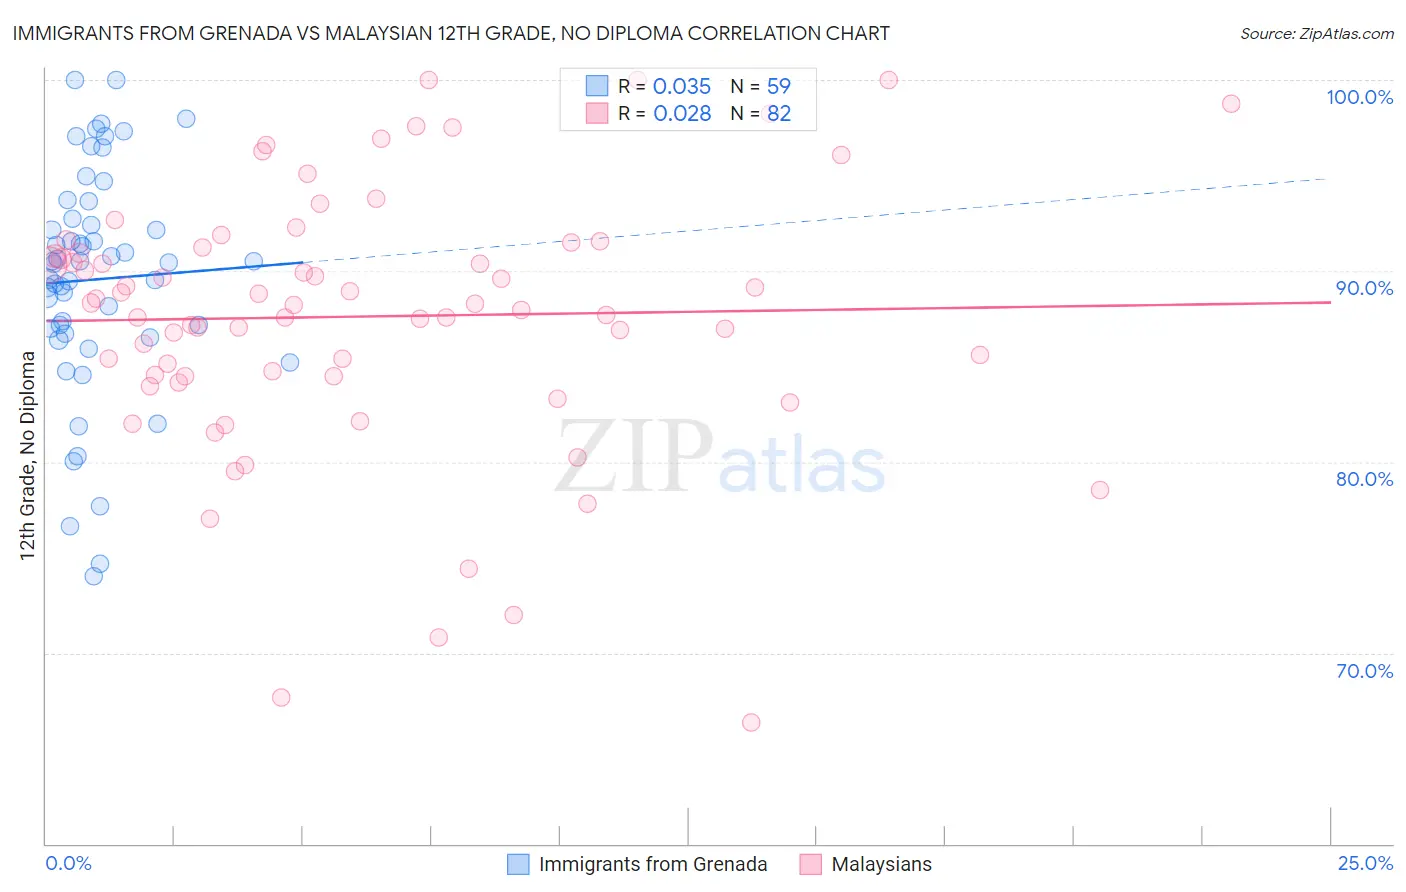
Immigrants from Grenada vs Malaysian 12th Grade, No Diploma Correlation Chart
The statistical analysis conducted on geographies consisting of 67,201,908 people shows no correlation between the proportion of Immigrants from Grenada and percentage of population with at least 12th grade (no diploma) education in the United States with a correlation coefficient (R) of 0.035 and weighted average of 88.4%. Similarly, the statistical analysis conducted on geographies consisting of 226,109,984 people shows no correlation between the proportion of Malaysians and percentage of population with at least 12th grade (no diploma) education in the United States with a correlation coefficient (R) of 0.028 and weighted average of 89.2%, a difference of 0.96%.
12th Grade, No Diploma Correlation Summary
| Measurement | Immigrants from Grenada | Malaysian |
| Minimum | 74.0% | 66.4% |
| Maximum | 100.0% | 100.0% |
| Range | 26.0% | 33.6% |
| Mean | 89.6% | 87.6% |
| Median | 90.4% | 88.2% |
| Interquartile 25% (IQ1) | 86.7% | 84.5% |
| Interquartile 75% (IQ3) | 92.8% | 91.2% |
| Interquartile Range (IQR) | 6.0% | 6.7% |
| Standard Deviation (Sample) | 5.9% | 6.9% |
| Standard Deviation (Population) | 5.9% | 6.8% |
Demographics Similar to Immigrants from Grenada and Malaysians by 12th Grade, No Diploma
In terms of 12th grade, no diploma, the demographic groups most similar to Immigrants from Grenada are Dutch West Indian (88.5%, a difference of 0.17%), British West Indian (88.5%, a difference of 0.17%), Haitian (88.5%, a difference of 0.17%), Immigrants from Fiji (88.6%, a difference of 0.27%), and Hopi (88.6%, a difference of 0.28%). Similarly, the demographic groups most similar to Malaysians are Barbadian (89.1%, a difference of 0.13%), Cajun (89.1%, a difference of 0.14%), Immigrants from Congo (89.0%, a difference of 0.22%), Ute (89.0%, a difference of 0.22%), and Immigrants from Barbados (89.0%, a difference of 0.27%).
| Demographics | Rating | Rank | 12th Grade, No Diploma |
| Malaysians | 0.1 /100 | #272 | Tragic 89.2% |
| Barbadians | 0.1 /100 | #273 | Tragic 89.1% |
| Cajuns | 0.1 /100 | #274 | Tragic 89.1% |
| Immigrants | Congo | 0.1 /100 | #275 | Tragic 89.0% |
| Ute | 0.1 /100 | #276 | Tragic 89.0% |
| Immigrants | Barbados | 0.0 /100 | #277 | Tragic 89.0% |
| Immigrants | St. Vincent and the Grenadines | 0.0 /100 | #278 | Tragic 88.9% |
| Immigrants | Laos | 0.0 /100 | #279 | Tragic 88.9% |
| Immigrants | Burma/Myanmar | 0.0 /100 | #280 | Tragic 88.9% |
| Cubans | 0.0 /100 | #281 | Tragic 88.9% |
| Immigrants | Vietnam | 0.0 /100 | #282 | Tragic 88.7% |
| Paiute | 0.0 /100 | #283 | Tragic 88.7% |
| Pennsylvania Germans | 0.0 /100 | #284 | Tragic 88.7% |
| Indonesians | 0.0 /100 | #285 | Tragic 88.6% |
| Immigrants | West Indies | 0.0 /100 | #286 | Tragic 88.6% |
| Hopi | 0.0 /100 | #287 | Tragic 88.6% |
| Immigrants | Fiji | 0.0 /100 | #288 | Tragic 88.6% |
| Dutch West Indians | 0.0 /100 | #289 | Tragic 88.5% |
| British West Indians | 0.0 /100 | #290 | Tragic 88.5% |
| Haitians | 0.0 /100 | #291 | Tragic 88.5% |
| Immigrants | Grenada | 0.0 /100 | #292 | Tragic 88.4% |