Immigrants from Grenada vs Afghan 12th Grade, No Diploma
COMPARE
Immigrants from Grenada
Afghan
12th Grade, No Diploma
12th Grade, No Diploma Comparison
Immigrants from Grenada
Afghans
88.4%
12TH GRADE, NO DIPLOMA
0.0/ 100
METRIC RATING
292nd/ 347
METRIC RANK
90.9%
12TH GRADE, NO DIPLOMA
29.9/ 100
METRIC RATING
190th/ 347
METRIC RANK
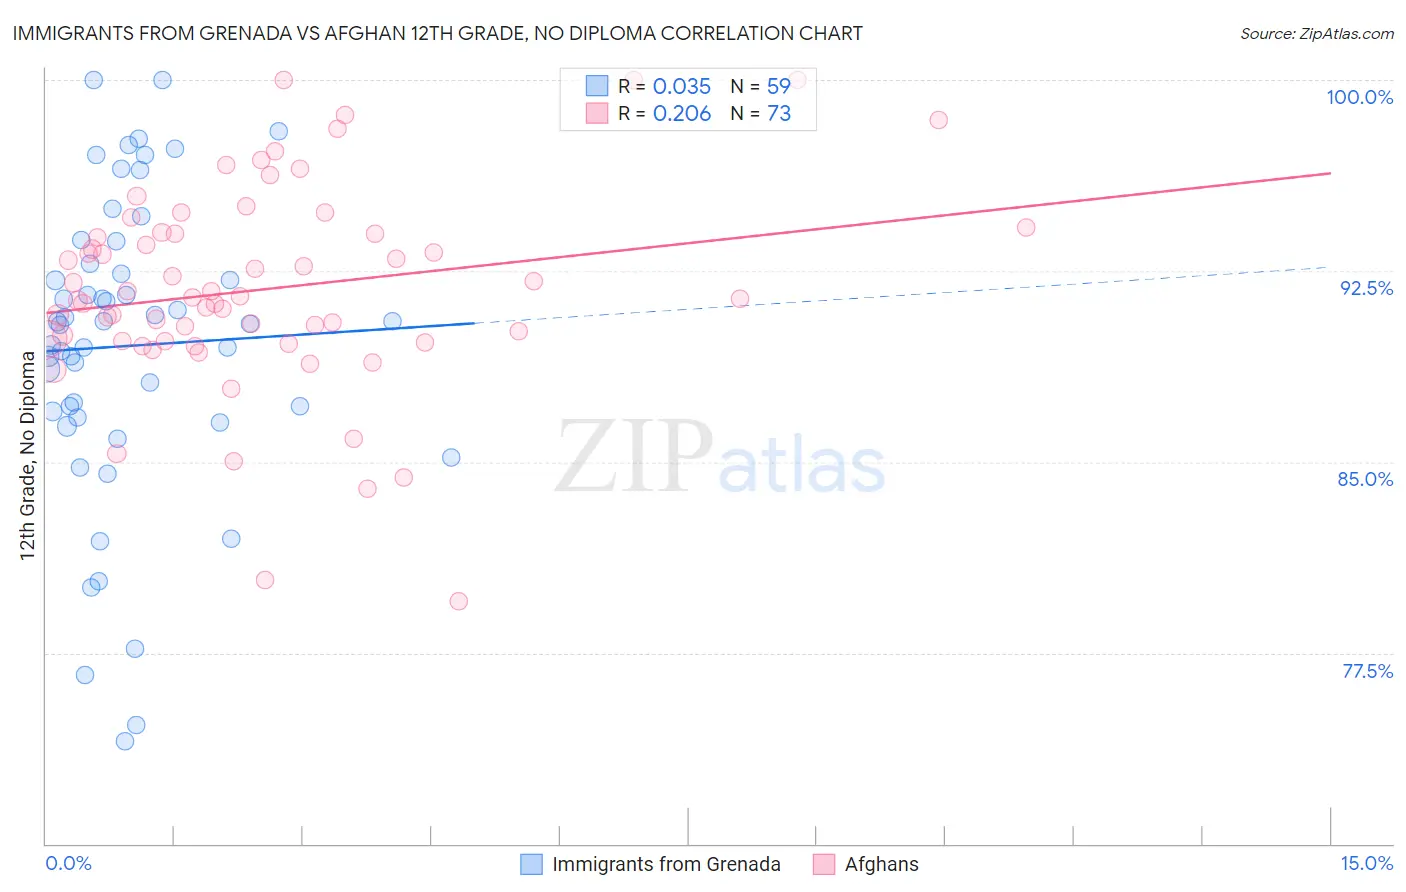
Immigrants from Grenada vs Afghan 12th Grade, No Diploma Correlation Chart
The statistical analysis conducted on geographies consisting of 67,201,908 people shows no correlation between the proportion of Immigrants from Grenada and percentage of population with at least 12th grade (no diploma) education in the United States with a correlation coefficient (R) of 0.035 and weighted average of 88.4%. Similarly, the statistical analysis conducted on geographies consisting of 148,850,509 people shows a weak positive correlation between the proportion of Afghans and percentage of population with at least 12th grade (no diploma) education in the United States with a correlation coefficient (R) of 0.206 and weighted average of 90.9%, a difference of 2.9%.
12th Grade, No Diploma Correlation Summary
| Measurement | Immigrants from Grenada | Afghan |
| Minimum | 74.0% | 79.5% |
| Maximum | 100.0% | 100.0% |
| Range | 26.0% | 20.5% |
| Mean | 89.6% | 91.8% |
| Median | 90.4% | 91.5% |
| Interquartile 25% (IQ1) | 86.7% | 89.7% |
| Interquartile 75% (IQ3) | 92.8% | 94.0% |
| Interquartile Range (IQR) | 6.0% | 4.3% |
| Standard Deviation (Sample) | 5.9% | 4.0% |
| Standard Deviation (Population) | 5.9% | 4.0% |
Similar Demographics by 12th Grade, No Diploma
Demographics Similar to Immigrants from Grenada by 12th Grade, No Diploma
In terms of 12th grade, no diploma, the demographic groups most similar to Immigrants from Grenada are Japanese (88.3%, a difference of 0.090%), Guyanese (88.3%, a difference of 0.15%), Dutch West Indian (88.5%, a difference of 0.17%), British West Indian (88.5%, a difference of 0.17%), and Haitian (88.5%, a difference of 0.17%).
| Demographics | Rating | Rank | 12th Grade, No Diploma |
| Indonesians | 0.0 /100 | #285 | Tragic 88.6% |
| Immigrants | West Indies | 0.0 /100 | #286 | Tragic 88.6% |
| Hopi | 0.0 /100 | #287 | Tragic 88.6% |
| Immigrants | Fiji | 0.0 /100 | #288 | Tragic 88.6% |
| Dutch West Indians | 0.0 /100 | #289 | Tragic 88.5% |
| British West Indians | 0.0 /100 | #290 | Tragic 88.5% |
| Haitians | 0.0 /100 | #291 | Tragic 88.5% |
| Immigrants | Grenada | 0.0 /100 | #292 | Tragic 88.4% |
| Japanese | 0.0 /100 | #293 | Tragic 88.3% |
| Guyanese | 0.0 /100 | #294 | Tragic 88.3% |
| Immigrants | Immigrants | 0.0 /100 | #295 | Tragic 88.2% |
| Fijians | 0.0 /100 | #296 | Tragic 88.2% |
| Pueblo | 0.0 /100 | #297 | Tragic 88.2% |
| Immigrants | Haiti | 0.0 /100 | #298 | Tragic 88.2% |
| Nepalese | 0.0 /100 | #299 | Tragic 88.1% |
Demographics Similar to Afghans by 12th Grade, No Diploma
In terms of 12th grade, no diploma, the demographic groups most similar to Afghans are Moroccan (90.9%, a difference of 0.010%), Immigrants from Uganda (90.9%, a difference of 0.030%), Immigrants from Eastern Africa (90.9%, a difference of 0.030%), Potawatomi (91.0%, a difference of 0.040%), and American (91.0%, a difference of 0.040%).
| Demographics | Rating | Rank | 12th Grade, No Diploma |
| Osage | 38.3 /100 | #183 | Fair 91.0% |
| Spaniards | 36.2 /100 | #184 | Fair 91.0% |
| Sudanese | 34.4 /100 | #185 | Fair 91.0% |
| Ethiopians | 33.9 /100 | #186 | Fair 91.0% |
| Potawatomi | 32.9 /100 | #187 | Fair 91.0% |
| Americans | 32.6 /100 | #188 | Fair 91.0% |
| Immigrants | Uganda | 31.6 /100 | #189 | Fair 90.9% |
| Afghans | 29.9 /100 | #190 | Fair 90.9% |
| Moroccans | 28.8 /100 | #191 | Fair 90.9% |
| Immigrants | Eastern Africa | 27.7 /100 | #192 | Fair 90.9% |
| Immigrants | Ethiopia | 27.2 /100 | #193 | Fair 90.9% |
| Immigrants | Oceania | 26.0 /100 | #194 | Fair 90.9% |
| Koreans | 24.5 /100 | #195 | Fair 90.8% |
| Panamanians | 22.8 /100 | #196 | Fair 90.8% |
| Immigrants | Sudan | 22.6 /100 | #197 | Fair 90.8% |