Immigrants from France vs Central American Nursery School
COMPARE
Immigrants from France
Central American
Nursery School
Nursery School Comparison
Immigrants from France
Central Americans
98.2%
NURSERY SCHOOL
95.6/ 100
METRIC RATING
117th/ 347
METRIC RANK
96.6%
NURSERY SCHOOL
0.0/ 100
METRIC RATING
333rd/ 347
METRIC RANK
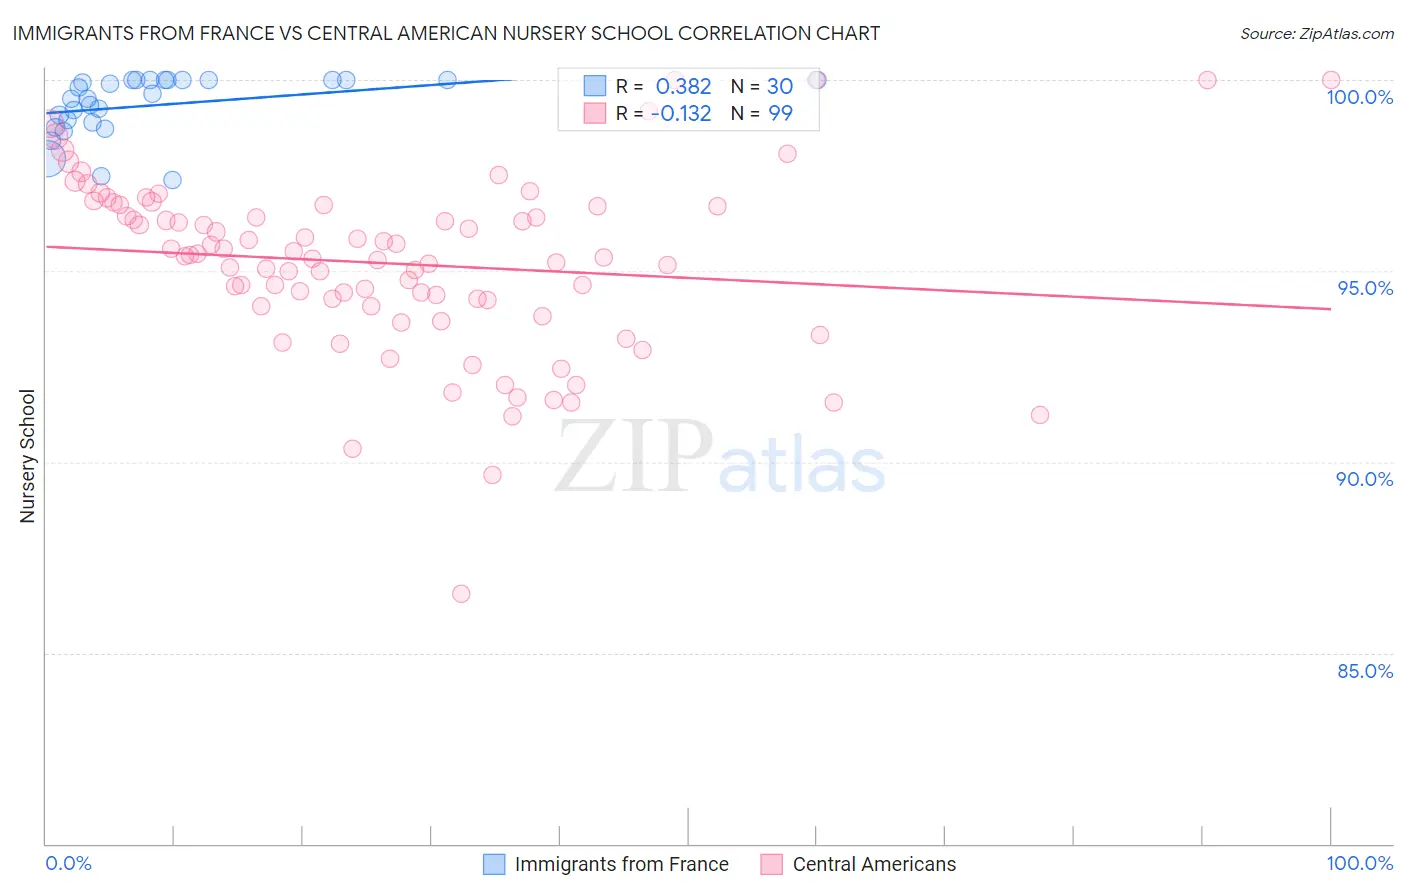
Immigrants from France vs Central American Nursery School Correlation Chart
The statistical analysis conducted on geographies consisting of 287,920,814 people shows a mild positive correlation between the proportion of Immigrants from France and percentage of population with at least nursery school education in the United States with a correlation coefficient (R) of 0.382 and weighted average of 98.2%. Similarly, the statistical analysis conducted on geographies consisting of 504,619,275 people shows a poor negative correlation between the proportion of Central Americans and percentage of population with at least nursery school education in the United States with a correlation coefficient (R) of -0.132 and weighted average of 96.6%, a difference of 1.6%.
Nursery School Correlation Summary
| Measurement | Immigrants from France | Central American |
| Minimum | 97.4% | 86.5% |
| Maximum | 100.0% | 100.0% |
| Range | 2.6% | 13.5% |
| Mean | 99.3% | 95.2% |
| Median | 99.6% | 95.4% |
| Interquartile 25% (IQ1) | 98.9% | 94.1% |
| Interquartile 75% (IQ3) | 100.0% | 96.7% |
| Interquartile Range (IQR) | 1.1% | 2.6% |
| Standard Deviation (Sample) | 0.78% | 2.3% |
| Standard Deviation (Population) | 0.77% | 2.3% |
Similar Demographics by Nursery School
Demographics Similar to Immigrants from France by Nursery School
In terms of nursery school, the demographic groups most similar to Immigrants from France are Spanish (98.2%, a difference of 0.0%), Yugoslavian (98.2%, a difference of 0.0%), Ute (98.2%, a difference of 0.010%), Iranian (98.2%, a difference of 0.010%), and Thai (98.2%, a difference of 0.010%).
| Demographics | Rating | Rank | Nursery School |
| Immigrants | Singapore | 96.9 /100 | #110 | Exceptional 98.2% |
| Immigrants | Czechoslovakia | 96.8 /100 | #111 | Exceptional 98.2% |
| Immigrants | Norway | 96.6 /100 | #112 | Exceptional 98.2% |
| Immigrants | Latvia | 96.4 /100 | #113 | Exceptional 98.2% |
| Ute | 96.4 /100 | #114 | Exceptional 98.2% |
| Iranians | 96.3 /100 | #115 | Exceptional 98.2% |
| Spanish | 95.8 /100 | #116 | Exceptional 98.2% |
| Immigrants | France | 95.6 /100 | #117 | Exceptional 98.2% |
| Yugoslavians | 95.4 /100 | #118 | Exceptional 98.2% |
| Thais | 95.0 /100 | #119 | Exceptional 98.2% |
| Okinawans | 94.5 /100 | #120 | Exceptional 98.2% |
| Immigrants | Zimbabwe | 94.2 /100 | #121 | Exceptional 98.2% |
| Immigrants | Japan | 94.0 /100 | #122 | Exceptional 98.2% |
| Syrians | 93.9 /100 | #123 | Exceptional 98.2% |
| Lebanese | 93.8 /100 | #124 | Exceptional 98.2% |
Demographics Similar to Central Americans by Nursery School
In terms of nursery school, the demographic groups most similar to Central Americans are Immigrants from Dominican Republic (96.6%, a difference of 0.010%), Yakama (96.6%, a difference of 0.020%), Immigrants from Armenia (96.7%, a difference of 0.030%), Bangladeshi (96.6%, a difference of 0.040%), and Immigrants from Vietnam (96.7%, a difference of 0.060%).
| Demographics | Rating | Rank | Nursery School |
| Indonesians | 0.0 /100 | #326 | Tragic 96.8% |
| Mexicans | 0.0 /100 | #327 | Tragic 96.8% |
| Immigrants | Latin America | 0.0 /100 | #328 | Tragic 96.7% |
| Immigrants | Vietnam | 0.0 /100 | #329 | Tragic 96.7% |
| Japanese | 0.0 /100 | #330 | Tragic 96.7% |
| Immigrants | Armenia | 0.0 /100 | #331 | Tragic 96.7% |
| Yakama | 0.0 /100 | #332 | Tragic 96.6% |
| Central Americans | 0.0 /100 | #333 | Tragic 96.6% |
| Immigrants | Dominican Republic | 0.0 /100 | #334 | Tragic 96.6% |
| Bangladeshis | 0.0 /100 | #335 | Tragic 96.6% |
| Guatemalans | 0.0 /100 | #336 | Tragic 96.6% |
| Immigrants | Cambodia | 0.0 /100 | #337 | Tragic 96.5% |
| Immigrants | Fiji | 0.0 /100 | #338 | Tragic 96.5% |
| Immigrants | Guatemala | 0.0 /100 | #339 | Tragic 96.4% |
| Immigrants | Central America | 0.0 /100 | #340 | Tragic 96.4% |