Immigrants from Fiji vs Ute 6th Grade
COMPARE
Immigrants from Fiji
Ute
6th Grade
6th Grade Comparison
Immigrants from Fiji
Ute
95.2%
6TH GRADE
0.0/ 100
METRIC RATING
321st/ 347
METRIC RANK
97.1%
6TH GRADE
71.1/ 100
METRIC RATING
155th/ 347
METRIC RANK
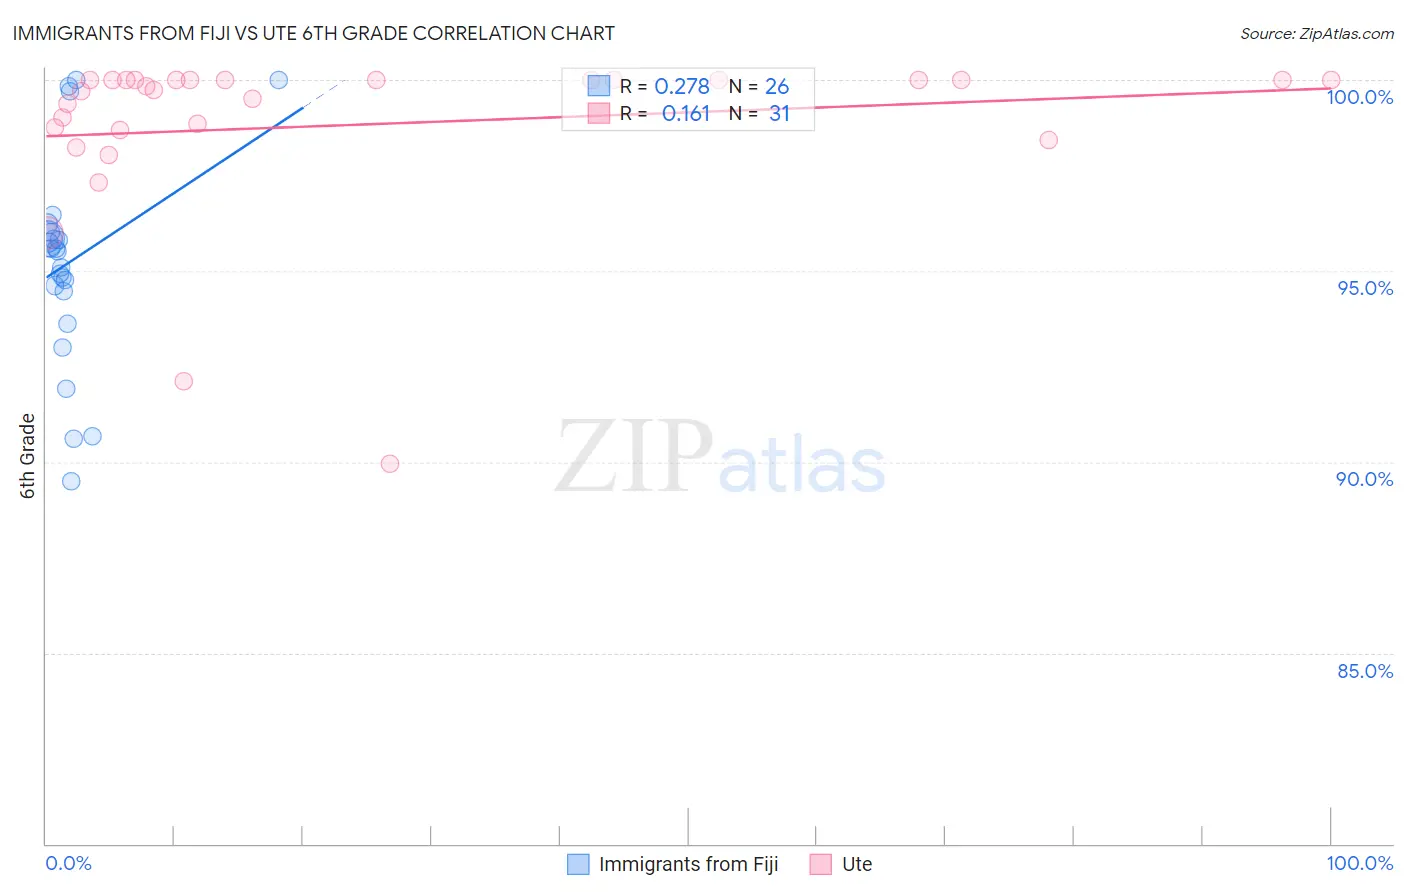
Immigrants from Fiji vs Ute 6th Grade Correlation Chart
The statistical analysis conducted on geographies consisting of 93,756,204 people shows a weak positive correlation between the proportion of Immigrants from Fiji and percentage of population with at least 6th grade education in the United States with a correlation coefficient (R) of 0.278 and weighted average of 95.2%. Similarly, the statistical analysis conducted on geographies consisting of 55,668,539 people shows a poor positive correlation between the proportion of Ute and percentage of population with at least 6th grade education in the United States with a correlation coefficient (R) of 0.161 and weighted average of 97.1%, a difference of 2.0%.
6th Grade Correlation Summary
| Measurement | Immigrants from Fiji | Ute |
| Minimum | 89.5% | 89.9% |
| Maximum | 100.0% | 100.0% |
| Range | 10.5% | 10.1% |
| Mean | 95.2% | 98.8% |
| Median | 95.5% | 99.8% |
| Interquartile 25% (IQ1) | 94.5% | 98.7% |
| Interquartile 75% (IQ3) | 96.0% | 100.0% |
| Interquartile Range (IQR) | 1.6% | 1.3% |
| Standard Deviation (Sample) | 2.7% | 2.3% |
| Standard Deviation (Population) | 2.7% | 2.3% |
Similar Demographics by 6th Grade
Demographics Similar to Immigrants from Fiji by 6th Grade
In terms of 6th grade, the demographic groups most similar to Immigrants from Fiji are Immigrants from Cambodia (95.2%, a difference of 0.050%), Immigrants from Ecuador (95.3%, a difference of 0.060%), Central American Indian (95.1%, a difference of 0.060%), Cape Verdean (95.1%, a difference of 0.090%), and Immigrants from Belize (95.3%, a difference of 0.10%).
| Demographics | Rating | Rank | 6th Grade |
| Immigrants | Vietnam | 0.0 /100 | #314 | Tragic 95.4% |
| Immigrants | Bangladesh | 0.0 /100 | #315 | Tragic 95.4% |
| Japanese | 0.0 /100 | #316 | Tragic 95.4% |
| Vietnamese | 0.0 /100 | #317 | Tragic 95.3% |
| Belizeans | 0.0 /100 | #318 | Tragic 95.3% |
| Immigrants | Belize | 0.0 /100 | #319 | Tragic 95.3% |
| Immigrants | Ecuador | 0.0 /100 | #320 | Tragic 95.3% |
| Immigrants | Fiji | 0.0 /100 | #321 | Tragic 95.2% |
| Immigrants | Cambodia | 0.0 /100 | #322 | Tragic 95.2% |
| Central American Indians | 0.0 /100 | #323 | Tragic 95.1% |
| Cape Verdeans | 0.0 /100 | #324 | Tragic 95.1% |
| Immigrants | Nicaragua | 0.0 /100 | #325 | Tragic 95.1% |
| Hispanics or Latinos | 0.0 /100 | #326 | Tragic 95.0% |
| Mexican American Indians | 0.0 /100 | #327 | Tragic 95.0% |
| Hondurans | 0.0 /100 | #328 | Tragic 95.0% |
Demographics Similar to Ute by 6th Grade
In terms of 6th grade, the demographic groups most similar to Ute are Soviet Union (97.2%, a difference of 0.0%), Immigrants from Jordan (97.2%, a difference of 0.010%), Immigrants from Eastern Europe (97.2%, a difference of 0.010%), Alsatian (97.1%, a difference of 0.010%), and Immigrants from Bosnia and Herzegovina (97.2%, a difference of 0.020%).
| Demographics | Rating | Rank | 6th Grade |
| Immigrants | Greece | 77.8 /100 | #148 | Good 97.2% |
| Immigrants | Israel | 76.0 /100 | #149 | Good 97.2% |
| Immigrants | Bosnia and Herzegovina | 74.8 /100 | #150 | Good 97.2% |
| French American Indians | 74.0 /100 | #151 | Good 97.2% |
| Immigrants | Jordan | 73.0 /100 | #152 | Good 97.2% |
| Immigrants | Eastern Europe | 72.6 /100 | #153 | Good 97.2% |
| Soviet Union | 71.5 /100 | #154 | Good 97.2% |
| Ute | 71.1 /100 | #155 | Good 97.1% |
| Alsatians | 69.8 /100 | #156 | Good 97.1% |
| Immigrants | Russia | 67.6 /100 | #157 | Good 97.1% |
| Immigrants | Iran | 63.3 /100 | #158 | Good 97.1% |
| Kenyans | 62.9 /100 | #159 | Good 97.1% |
| Ugandans | 62.2 /100 | #160 | Good 97.1% |
| Immigrants | Belarus | 60.4 /100 | #161 | Good 97.1% |
| Marshallese | 60.2 /100 | #162 | Good 97.1% |