Immigrants from Austria vs Ute 6th Grade
COMPARE
Immigrants from Austria
Ute
6th Grade
6th Grade Comparison
Immigrants from Austria
Ute
97.7%
6TH GRADE
99.6/ 100
METRIC RATING
68th/ 347
METRIC RANK
97.1%
6TH GRADE
71.1/ 100
METRIC RATING
155th/ 347
METRIC RANK
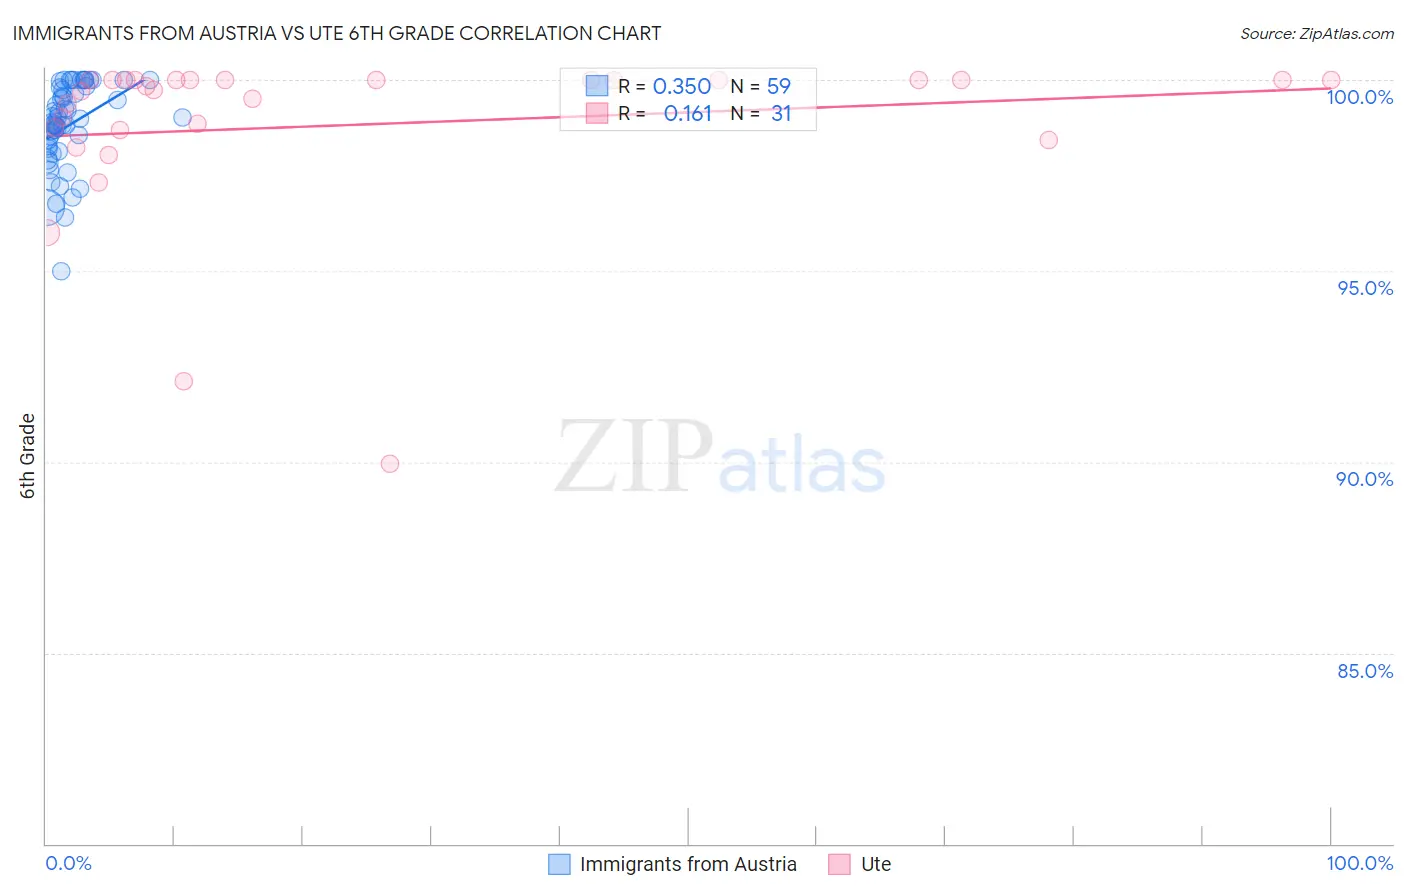
Immigrants from Austria vs Ute 6th Grade Correlation Chart
The statistical analysis conducted on geographies consisting of 167,973,800 people shows a mild positive correlation between the proportion of Immigrants from Austria and percentage of population with at least 6th grade education in the United States with a correlation coefficient (R) of 0.350 and weighted average of 97.7%. Similarly, the statistical analysis conducted on geographies consisting of 55,668,539 people shows a poor positive correlation between the proportion of Ute and percentage of population with at least 6th grade education in the United States with a correlation coefficient (R) of 0.161 and weighted average of 97.1%, a difference of 0.53%.
6th Grade Correlation Summary
| Measurement | Immigrants from Austria | Ute |
| Minimum | 95.0% | 89.9% |
| Maximum | 100.0% | 100.0% |
| Range | 5.0% | 10.1% |
| Mean | 98.8% | 98.8% |
| Median | 99.0% | 99.8% |
| Interquartile 25% (IQ1) | 98.2% | 98.7% |
| Interquartile 75% (IQ3) | 99.8% | 100.0% |
| Interquartile Range (IQR) | 1.6% | 1.3% |
| Standard Deviation (Sample) | 1.1% | 2.3% |
| Standard Deviation (Population) | 1.1% | 2.3% |
Similar Demographics by 6th Grade
Demographics Similar to Immigrants from Austria by 6th Grade
In terms of 6th grade, the demographic groups most similar to Immigrants from Austria are New Zealander (97.7%, a difference of 0.0%), Kiowa (97.7%, a difference of 0.0%), Immigrants from Northern Europe (97.7%, a difference of 0.010%), Russian (97.7%, a difference of 0.020%), and Canadian (97.7%, a difference of 0.020%).
| Demographics | Rating | Rank | 6th Grade |
| Serbians | 99.7 /100 | #61 | Exceptional 97.7% |
| Immigrants | North America | 99.7 /100 | #62 | Exceptional 97.7% |
| Russians | 99.7 /100 | #63 | Exceptional 97.7% |
| Canadians | 99.7 /100 | #64 | Exceptional 97.7% |
| Immigrants | Northern Europe | 99.6 /100 | #65 | Exceptional 97.7% |
| New Zealanders | 99.6 /100 | #66 | Exceptional 97.7% |
| Kiowa | 99.6 /100 | #67 | Exceptional 97.7% |
| Immigrants | Austria | 99.6 /100 | #68 | Exceptional 97.7% |
| Iranians | 99.6 /100 | #69 | Exceptional 97.6% |
| Cajuns | 99.5 /100 | #70 | Exceptional 97.6% |
| Chickasaw | 99.5 /100 | #71 | Exceptional 97.6% |
| Macedonians | 99.4 /100 | #72 | Exceptional 97.6% |
| Cherokee | 99.4 /100 | #73 | Exceptional 97.6% |
| Immigrants | Netherlands | 99.4 /100 | #74 | Exceptional 97.6% |
| Ukrainians | 99.4 /100 | #75 | Exceptional 97.6% |
Demographics Similar to Ute by 6th Grade
In terms of 6th grade, the demographic groups most similar to Ute are Soviet Union (97.2%, a difference of 0.0%), Immigrants from Jordan (97.2%, a difference of 0.010%), Immigrants from Eastern Europe (97.2%, a difference of 0.010%), Alsatian (97.1%, a difference of 0.010%), and Immigrants from Bosnia and Herzegovina (97.2%, a difference of 0.020%).
| Demographics | Rating | Rank | 6th Grade |
| Immigrants | Greece | 77.8 /100 | #148 | Good 97.2% |
| Immigrants | Israel | 76.0 /100 | #149 | Good 97.2% |
| Immigrants | Bosnia and Herzegovina | 74.8 /100 | #150 | Good 97.2% |
| French American Indians | 74.0 /100 | #151 | Good 97.2% |
| Immigrants | Jordan | 73.0 /100 | #152 | Good 97.2% |
| Immigrants | Eastern Europe | 72.6 /100 | #153 | Good 97.2% |
| Soviet Union | 71.5 /100 | #154 | Good 97.2% |
| Ute | 71.1 /100 | #155 | Good 97.1% |
| Alsatians | 69.8 /100 | #156 | Good 97.1% |
| Immigrants | Russia | 67.6 /100 | #157 | Good 97.1% |
| Immigrants | Iran | 63.3 /100 | #158 | Good 97.1% |
| Kenyans | 62.9 /100 | #159 | Good 97.1% |
| Ugandans | 62.2 /100 | #160 | Good 97.1% |
| Immigrants | Belarus | 60.4 /100 | #161 | Good 97.1% |
| Marshallese | 60.2 /100 | #162 | Good 97.1% |