Immigrants from Ethiopia vs Ugandan 10th Grade
COMPARE
Immigrants from Ethiopia
Ugandan
10th Grade
10th Grade Comparison
Immigrants from Ethiopia
Ugandans
93.1%
10TH GRADE
5.1/ 100
METRIC RATING
229th/ 347
METRIC RANK
94.0%
10TH GRADE
80.7/ 100
METRIC RATING
149th/ 347
METRIC RANK
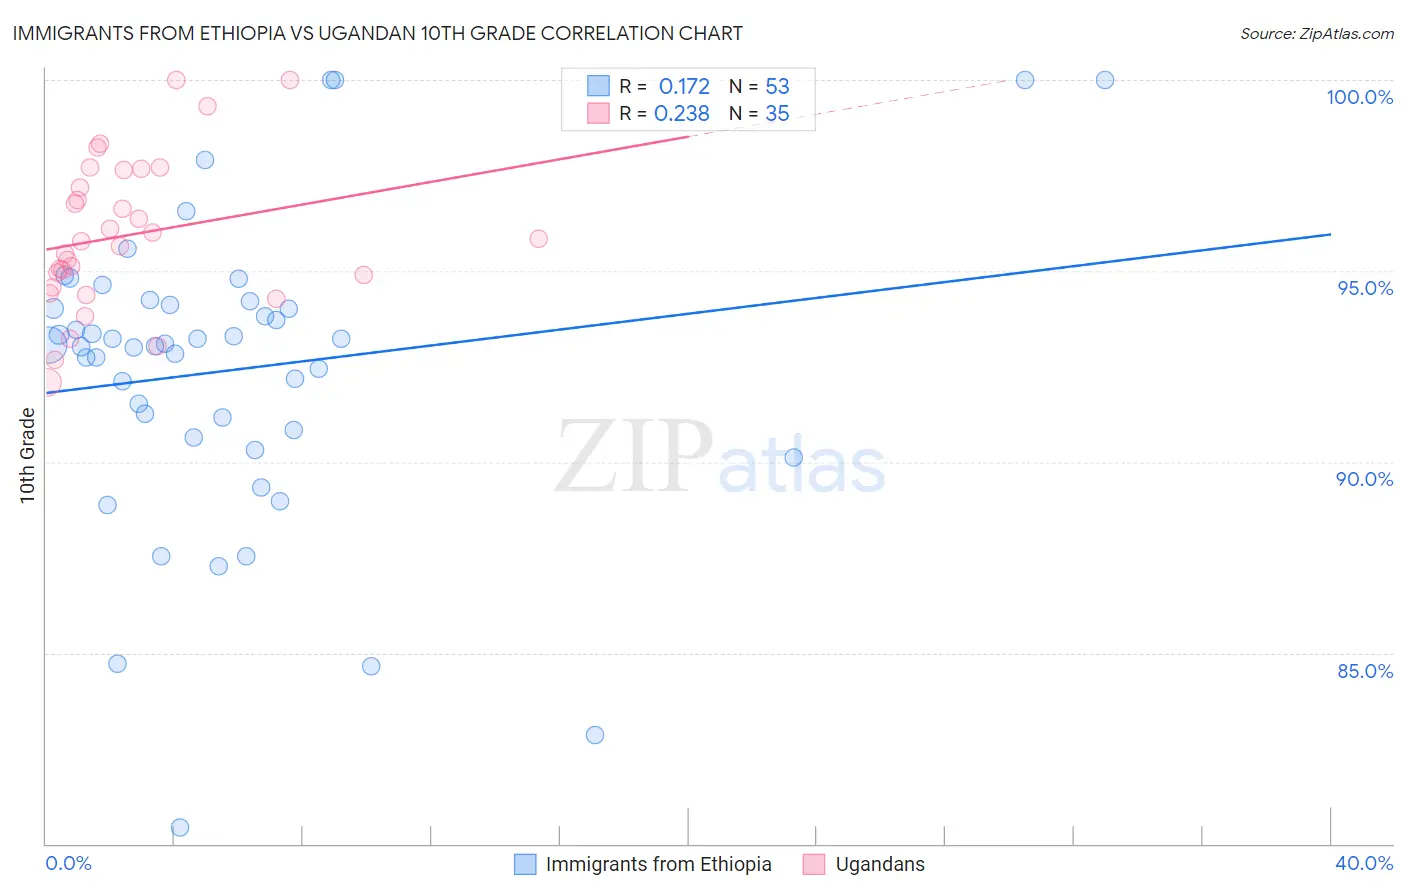
Immigrants from Ethiopia vs Ugandan 10th Grade Correlation Chart
The statistical analysis conducted on geographies consisting of 211,528,629 people shows a poor positive correlation between the proportion of Immigrants from Ethiopia and percentage of population with at least 10th grade education in the United States with a correlation coefficient (R) of 0.172 and weighted average of 93.1%. Similarly, the statistical analysis conducted on geographies consisting of 93,990,882 people shows a weak positive correlation between the proportion of Ugandans and percentage of population with at least 10th grade education in the United States with a correlation coefficient (R) of 0.238 and weighted average of 94.0%, a difference of 0.98%.
10th Grade Correlation Summary
| Measurement | Immigrants from Ethiopia | Ugandan |
| Minimum | 80.4% | 92.1% |
| Maximum | 100.0% | 100.0% |
| Range | 19.6% | 7.9% |
| Mean | 92.4% | 95.9% |
| Median | 93.1% | 95.8% |
| Interquartile 25% (IQ1) | 90.7% | 94.6% |
| Interquartile 75% (IQ3) | 94.2% | 97.6% |
| Interquartile Range (IQR) | 3.4% | 3.1% |
| Standard Deviation (Sample) | 4.0% | 2.0% |
| Standard Deviation (Population) | 3.9% | 1.9% |
Similar Demographics by 10th Grade
Demographics Similar to Immigrants from Ethiopia by 10th Grade
In terms of 10th grade, the demographic groups most similar to Immigrants from Ethiopia are Immigrants from Africa (93.1%, a difference of 0.0%), South American Indian (93.1%, a difference of 0.010%), Bahamian (93.1%, a difference of 0.010%), Comanche (93.1%, a difference of 0.010%), and Subsaharan African (93.1%, a difference of 0.020%).
| Demographics | Rating | Rank | 10th Grade |
| Ethiopians | 7.9 /100 | #222 | Tragic 93.2% |
| Immigrants | Sierra Leone | 7.6 /100 | #223 | Tragic 93.2% |
| Bolivians | 6.7 /100 | #224 | Tragic 93.2% |
| Somalis | 6.2 /100 | #225 | Tragic 93.2% |
| Koreans | 6.1 /100 | #226 | Tragic 93.2% |
| Blacks/African Americans | 6.0 /100 | #227 | Tragic 93.2% |
| Immigrants | China | 5.9 /100 | #228 | Tragic 93.2% |
| Immigrants | Ethiopia | 5.1 /100 | #229 | Tragic 93.1% |
| Immigrants | Africa | 5.0 /100 | #230 | Tragic 93.1% |
| South American Indians | 4.9 /100 | #231 | Tragic 93.1% |
| Bahamians | 4.9 /100 | #232 | Tragic 93.1% |
| Comanche | 4.9 /100 | #233 | Tragic 93.1% |
| Sub-Saharan Africans | 4.7 /100 | #234 | Tragic 93.1% |
| Africans | 4.6 /100 | #235 | Tragic 93.1% |
| Afghans | 4.5 /100 | #236 | Tragic 93.1% |
Demographics Similar to Ugandans by 10th Grade
In terms of 10th grade, the demographic groups most similar to Ugandans are Arab (94.0%, a difference of 0.0%), Immigrants from Ukraine (94.0%, a difference of 0.010%), Egyptian (94.0%, a difference of 0.020%), Kenyan (94.0%, a difference of 0.020%), and Chickasaw (94.1%, a difference of 0.030%).
| Demographics | Rating | Rank | 10th Grade |
| Albanians | 86.5 /100 | #142 | Excellent 94.1% |
| Cherokee | 84.9 /100 | #143 | Excellent 94.1% |
| Immigrants | Kazakhstan | 84.9 /100 | #144 | Excellent 94.1% |
| Immigrants | Nonimmigrants | 83.8 /100 | #145 | Excellent 94.1% |
| Chickasaw | 82.6 /100 | #146 | Excellent 94.1% |
| Immigrants | Ukraine | 81.5 /100 | #147 | Excellent 94.0% |
| Arabs | 80.9 /100 | #148 | Excellent 94.0% |
| Ugandans | 80.7 /100 | #149 | Excellent 94.0% |
| Egyptians | 79.6 /100 | #150 | Good 94.0% |
| Kenyans | 79.1 /100 | #151 | Good 94.0% |
| Immigrants | Italy | 78.0 /100 | #152 | Good 94.0% |
| Immigrants | Brazil | 75.5 /100 | #153 | Good 94.0% |
| Immigrants | Kenya | 75.3 /100 | #154 | Good 94.0% |
| Spanish | 74.9 /100 | #155 | Good 94.0% |
| Mongolians | 74.4 /100 | #156 | Good 94.0% |