Immigrants from Ethiopia vs Chippewa 10th Grade
COMPARE
Immigrants from Ethiopia
Chippewa
10th Grade
10th Grade Comparison
Immigrants from Ethiopia
Chippewa
93.1%
10TH GRADE
5.1/ 100
METRIC RATING
229th/ 347
METRIC RANK
95.0%
10TH GRADE
99.8/ 100
METRIC RATING
61st/ 347
METRIC RANK
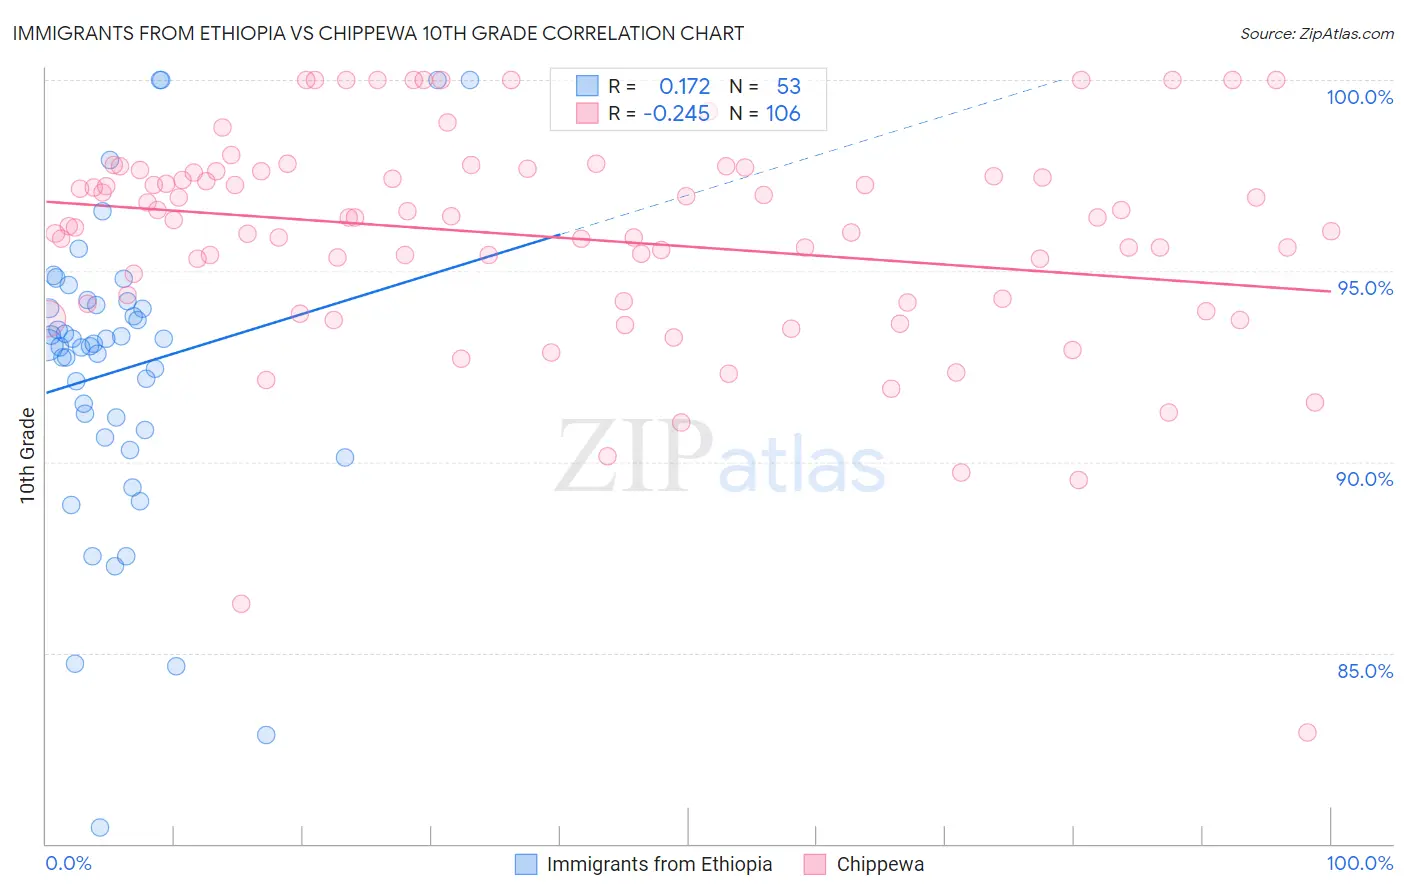
Immigrants from Ethiopia vs Chippewa 10th Grade Correlation Chart
The statistical analysis conducted on geographies consisting of 211,528,629 people shows a poor positive correlation between the proportion of Immigrants from Ethiopia and percentage of population with at least 10th grade education in the United States with a correlation coefficient (R) of 0.172 and weighted average of 93.1%. Similarly, the statistical analysis conducted on geographies consisting of 215,067,289 people shows a weak negative correlation between the proportion of Chippewa and percentage of population with at least 10th grade education in the United States with a correlation coefficient (R) of -0.245 and weighted average of 95.0%, a difference of 2.0%.
10th Grade Correlation Summary
| Measurement | Immigrants from Ethiopia | Chippewa |
| Minimum | 80.4% | 82.9% |
| Maximum | 100.0% | 100.0% |
| Range | 19.6% | 17.1% |
| Mean | 92.4% | 95.9% |
| Median | 93.1% | 96.4% |
| Interquartile 25% (IQ1) | 90.7% | 94.2% |
| Interquartile 75% (IQ3) | 94.2% | 97.6% |
| Interquartile Range (IQR) | 3.4% | 3.4% |
| Standard Deviation (Sample) | 4.0% | 2.9% |
| Standard Deviation (Population) | 3.9% | 2.9% |
Similar Demographics by 10th Grade
Demographics Similar to Immigrants from Ethiopia by 10th Grade
In terms of 10th grade, the demographic groups most similar to Immigrants from Ethiopia are Immigrants from Africa (93.1%, a difference of 0.0%), South American Indian (93.1%, a difference of 0.010%), Bahamian (93.1%, a difference of 0.010%), Comanche (93.1%, a difference of 0.010%), and Subsaharan African (93.1%, a difference of 0.020%).
| Demographics | Rating | Rank | 10th Grade |
| Ethiopians | 7.9 /100 | #222 | Tragic 93.2% |
| Immigrants | Sierra Leone | 7.6 /100 | #223 | Tragic 93.2% |
| Bolivians | 6.7 /100 | #224 | Tragic 93.2% |
| Somalis | 6.2 /100 | #225 | Tragic 93.2% |
| Koreans | 6.1 /100 | #226 | Tragic 93.2% |
| Blacks/African Americans | 6.0 /100 | #227 | Tragic 93.2% |
| Immigrants | China | 5.9 /100 | #228 | Tragic 93.2% |
| Immigrants | Ethiopia | 5.1 /100 | #229 | Tragic 93.1% |
| Immigrants | Africa | 5.0 /100 | #230 | Tragic 93.1% |
| South American Indians | 4.9 /100 | #231 | Tragic 93.1% |
| Bahamians | 4.9 /100 | #232 | Tragic 93.1% |
| Comanche | 4.9 /100 | #233 | Tragic 93.1% |
| Sub-Saharan Africans | 4.7 /100 | #234 | Tragic 93.1% |
| Africans | 4.6 /100 | #235 | Tragic 93.1% |
| Afghans | 4.5 /100 | #236 | Tragic 93.1% |
Demographics Similar to Chippewa by 10th Grade
In terms of 10th grade, the demographic groups most similar to Chippewa are Cypriot (95.0%, a difference of 0.0%), Aleut (95.0%, a difference of 0.010%), Celtic (95.0%, a difference of 0.010%), Thai (95.0%, a difference of 0.010%), and Immigrants from Singapore (95.0%, a difference of 0.010%).
| Demographics | Rating | Rank | 10th Grade |
| Immigrants | Lithuania | 99.8 /100 | #54 | Exceptional 95.0% |
| Immigrants | Ireland | 99.8 /100 | #55 | Exceptional 95.0% |
| New Zealanders | 99.8 /100 | #56 | Exceptional 95.0% |
| Ukrainians | 99.8 /100 | #57 | Exceptional 95.0% |
| Aleuts | 99.8 /100 | #58 | Exceptional 95.0% |
| Celtics | 99.8 /100 | #59 | Exceptional 95.0% |
| Cypriots | 99.8 /100 | #60 | Exceptional 95.0% |
| Chippewa | 99.8 /100 | #61 | Exceptional 95.0% |
| Thais | 99.8 /100 | #62 | Exceptional 95.0% |
| Immigrants | Singapore | 99.8 /100 | #63 | Exceptional 95.0% |
| Native Hawaiians | 99.7 /100 | #64 | Exceptional 95.0% |
| Turks | 99.7 /100 | #65 | Exceptional 95.0% |
| Immigrants | Australia | 99.7 /100 | #66 | Exceptional 94.9% |
| Immigrants | Netherlands | 99.7 /100 | #67 | Exceptional 94.9% |
| Immigrants | Belgium | 99.7 /100 | #68 | Exceptional 94.9% |