Immigrants from Ethiopia vs Immigrants from Cameroon Doctorate Degree
COMPARE
Immigrants from Ethiopia
Immigrants from Cameroon
Doctorate Degree
Doctorate Degree Comparison
Immigrants from Ethiopia
Immigrants from Cameroon
2.4%
DOCTORATE DEGREE
100.0/ 100
METRIC RATING
57th/ 347
METRIC RANK
2.0%
DOCTORATE DEGREE
88.9/ 100
METRIC RATING
134th/ 347
METRIC RANK
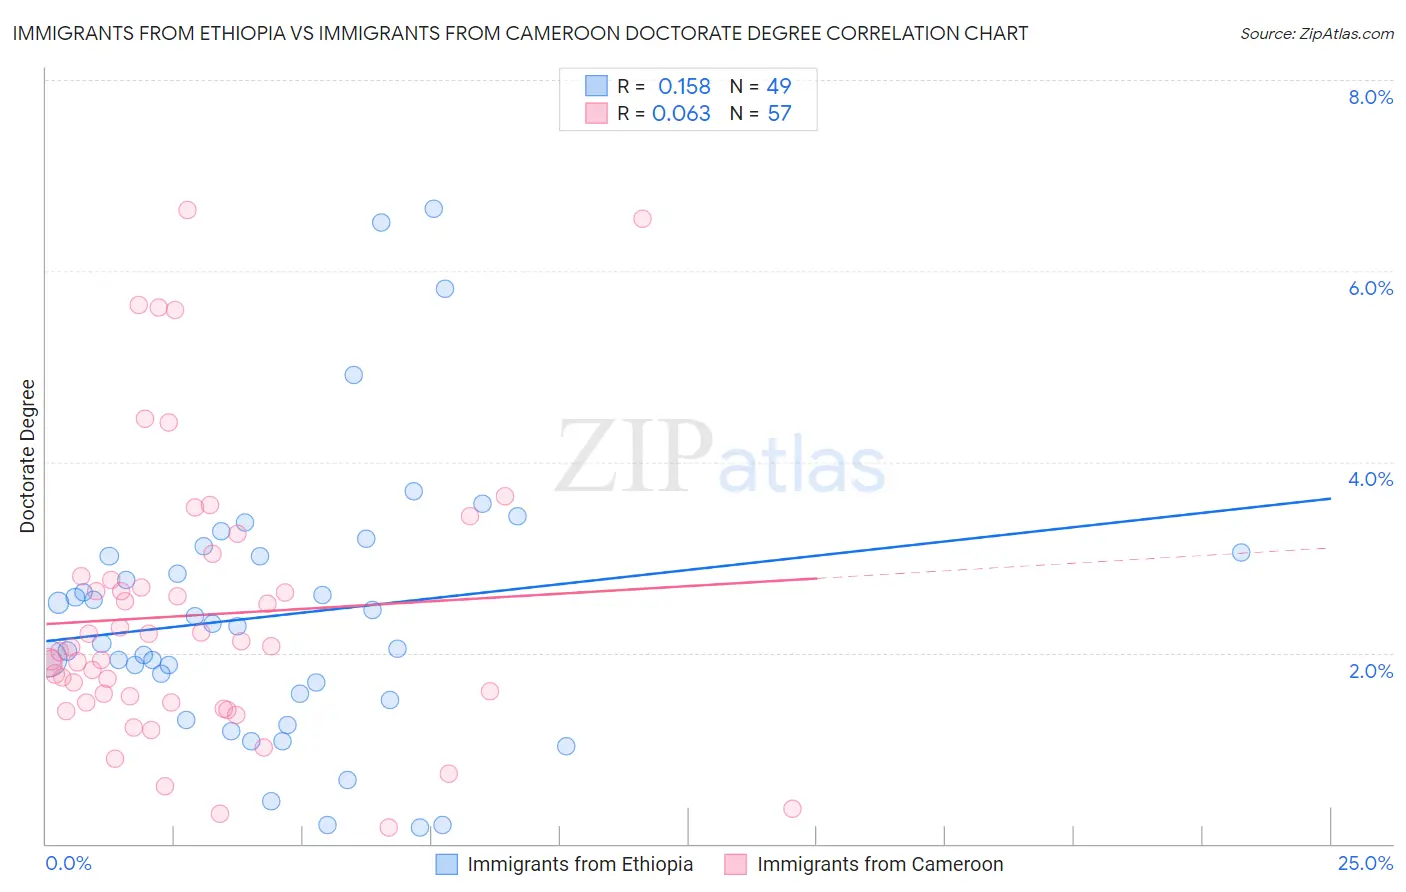
Immigrants from Ethiopia vs Immigrants from Cameroon Doctorate Degree Correlation Chart
The statistical analysis conducted on geographies consisting of 210,993,221 people shows a poor positive correlation between the proportion of Immigrants from Ethiopia and percentage of population with at least doctorate degree education in the United States with a correlation coefficient (R) of 0.158 and weighted average of 2.4%. Similarly, the statistical analysis conducted on geographies consisting of 130,429,472 people shows a slight positive correlation between the proportion of Immigrants from Cameroon and percentage of population with at least doctorate degree education in the United States with a correlation coefficient (R) of 0.063 and weighted average of 2.0%, a difference of 18.9%.
Doctorate Degree Correlation Summary
| Measurement | Immigrants from Ethiopia | Immigrants from Cameroon |
| Minimum | 0.18% | 0.17% |
| Maximum | 6.7% | 6.6% |
| Range | 6.5% | 6.5% |
| Mean | 2.4% | 2.4% |
| Median | 2.3% | 2.1% |
| Interquartile 25% (IQ1) | 1.5% | 1.5% |
| Interquartile 75% (IQ3) | 3.0% | 2.8% |
| Interquartile Range (IQR) | 1.5% | 1.3% |
| Standard Deviation (Sample) | 1.4% | 1.5% |
| Standard Deviation (Population) | 1.4% | 1.4% |
Similar Demographics by Doctorate Degree
Demographics Similar to Immigrants from Ethiopia by Doctorate Degree
In terms of doctorate degree, the demographic groups most similar to Immigrants from Ethiopia are Ethiopian (2.3%, a difference of 0.12%), Immigrants from Czechoslovakia (2.4%, a difference of 0.44%), Bolivian (2.4%, a difference of 0.53%), South African (2.3%, a difference of 0.56%), and Immigrants from Serbia (2.3%, a difference of 0.58%).
| Demographics | Rating | Rank | Doctorate Degree |
| Immigrants | Norway | 100.0 /100 | #50 | Exceptional 2.4% |
| Australians | 100.0 /100 | #51 | Exceptional 2.4% |
| Bulgarians | 100.0 /100 | #52 | Exceptional 2.4% |
| Immigrants | Latvia | 100.0 /100 | #53 | Exceptional 2.4% |
| Immigrants | Indonesia | 100.0 /100 | #54 | Exceptional 2.4% |
| Bolivians | 100.0 /100 | #55 | Exceptional 2.4% |
| Immigrants | Czechoslovakia | 100.0 /100 | #56 | Exceptional 2.4% |
| Immigrants | Ethiopia | 100.0 /100 | #57 | Exceptional 2.4% |
| Ethiopians | 99.9 /100 | #58 | Exceptional 2.3% |
| South Africans | 99.9 /100 | #59 | Exceptional 2.3% |
| Immigrants | Serbia | 99.9 /100 | #60 | Exceptional 2.3% |
| Bhutanese | 99.9 /100 | #61 | Exceptional 2.3% |
| Immigrants | Europe | 99.9 /100 | #62 | Exceptional 2.3% |
| Laotians | 99.9 /100 | #63 | Exceptional 2.3% |
| Immigrants | Greece | 99.9 /100 | #64 | Exceptional 2.3% |
Demographics Similar to Immigrants from Cameroon by Doctorate Degree
In terms of doctorate degree, the demographic groups most similar to Immigrants from Cameroon are Serbian (2.0%, a difference of 0.060%), Immigrants from Uzbekistan (2.0%, a difference of 0.15%), Scottish (2.0%, a difference of 0.20%), Swedish (2.0%, a difference of 0.21%), and South American Indian (2.0%, a difference of 0.21%).
| Demographics | Rating | Rank | Doctorate Degree |
| Palestinians | 92.0 /100 | #127 | Exceptional 2.0% |
| Immigrants | Zaire | 91.1 /100 | #128 | Exceptional 2.0% |
| Canadians | 90.6 /100 | #129 | Exceptional 2.0% |
| Immigrants | Ukraine | 90.5 /100 | #130 | Exceptional 2.0% |
| Immigrants | Sierra Leone | 90.2 /100 | #131 | Exceptional 2.0% |
| Scottish | 89.4 /100 | #132 | Excellent 2.0% |
| Immigrants | Uzbekistan | 89.3 /100 | #133 | Excellent 2.0% |
| Immigrants | Cameroon | 88.9 /100 | #134 | Excellent 2.0% |
| Serbians | 88.7 /100 | #135 | Excellent 2.0% |
| Swedes | 88.3 /100 | #136 | Excellent 2.0% |
| South American Indians | 88.3 /100 | #137 | Excellent 2.0% |
| Swiss | 88.0 /100 | #138 | Excellent 2.0% |
| Afghans | 87.2 /100 | #139 | Excellent 2.0% |
| Immigrants | Africa | 87.0 /100 | #140 | Excellent 2.0% |
| Senegalese | 86.7 /100 | #141 | Excellent 2.0% |