Alsatian vs Immigrants from Cameroon Doctorate Degree
COMPARE
Alsatian
Immigrants from Cameroon
Doctorate Degree
Doctorate Degree Comparison
Alsatians
Immigrants from Cameroon
2.1%
DOCTORATE DEGREE
99.0/ 100
METRIC RATING
93rd/ 347
METRIC RANK
2.0%
DOCTORATE DEGREE
88.9/ 100
METRIC RATING
134th/ 347
METRIC RANK
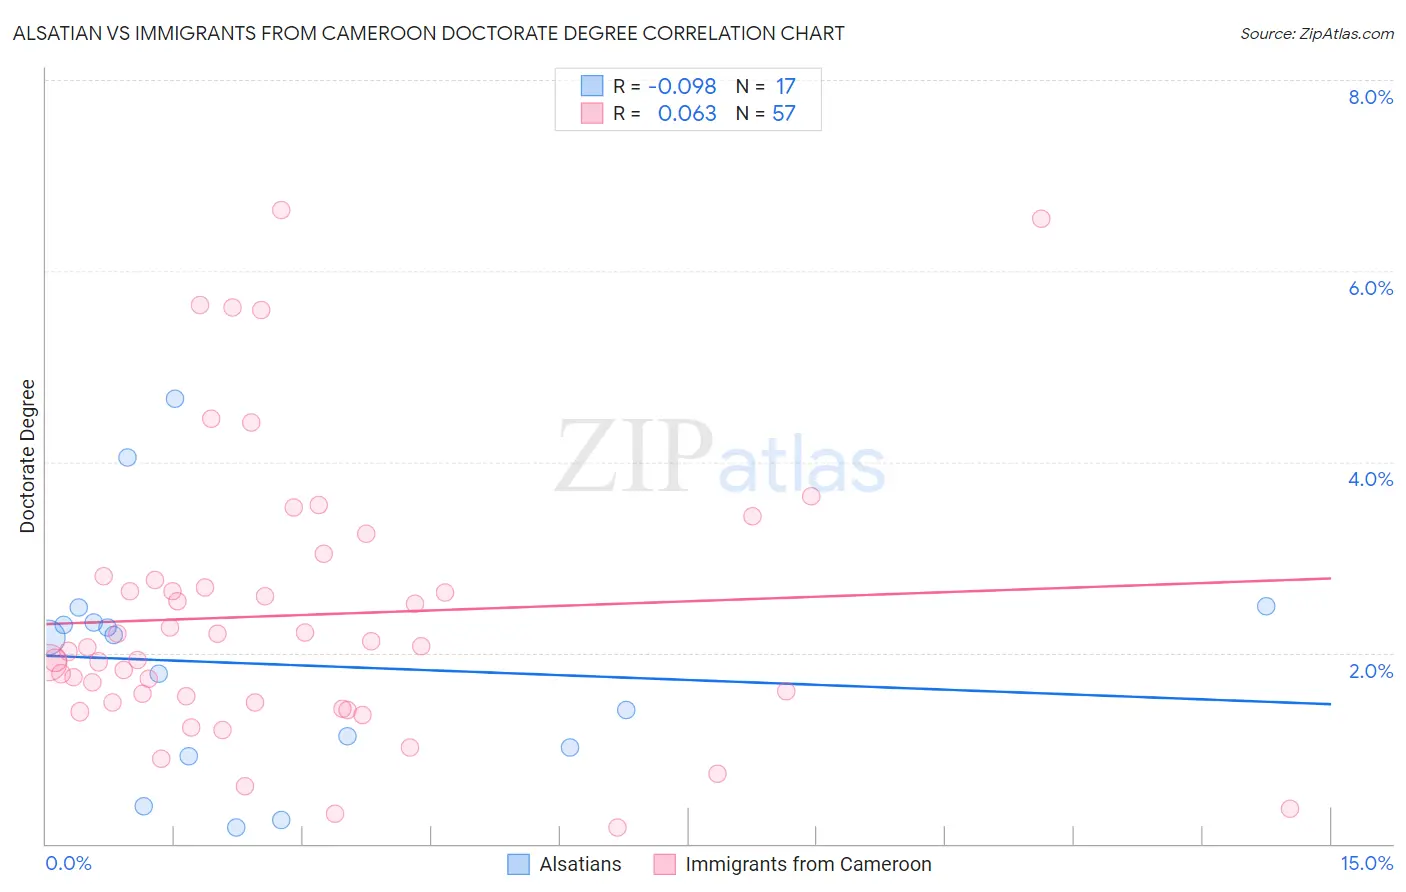
Alsatian vs Immigrants from Cameroon Doctorate Degree Correlation Chart
The statistical analysis conducted on geographies consisting of 82,508,744 people shows a slight negative correlation between the proportion of Alsatians and percentage of population with at least doctorate degree education in the United States with a correlation coefficient (R) of -0.098 and weighted average of 2.1%. Similarly, the statistical analysis conducted on geographies consisting of 130,429,472 people shows a slight positive correlation between the proportion of Immigrants from Cameroon and percentage of population with at least doctorate degree education in the United States with a correlation coefficient (R) of 0.063 and weighted average of 2.0%, a difference of 8.5%.
Doctorate Degree Correlation Summary
| Measurement | Alsatian | Immigrants from Cameroon |
| Minimum | 0.17% | 0.17% |
| Maximum | 4.7% | 6.6% |
| Range | 4.5% | 6.5% |
| Mean | 1.9% | 2.4% |
| Median | 2.2% | 2.1% |
| Interquartile 25% (IQ1) | 0.96% | 1.5% |
| Interquartile 75% (IQ3) | 2.4% | 2.8% |
| Interquartile Range (IQR) | 1.4% | 1.3% |
| Standard Deviation (Sample) | 1.2% | 1.5% |
| Standard Deviation (Population) | 1.2% | 1.4% |
Similar Demographics by Doctorate Degree
Demographics Similar to Alsatians by Doctorate Degree
In terms of doctorate degree, the demographic groups most similar to Alsatians are Chilean (2.2%, a difference of 0.22%), Immigrants from Sudan (2.2%, a difference of 0.48%), Greek (2.1%, a difference of 0.64%), Immigrants from Romania (2.1%, a difference of 0.78%), and Immigrants from Scotland (2.2%, a difference of 0.95%).
| Demographics | Rating | Rank | Doctorate Degree |
| Egyptians | 99.4 /100 | #86 | Exceptional 2.2% |
| Immigrants | Zimbabwe | 99.4 /100 | #87 | Exceptional 2.2% |
| Immigrants | Nepal | 99.3 /100 | #88 | Exceptional 2.2% |
| British | 99.3 /100 | #89 | Exceptional 2.2% |
| Immigrants | Scotland | 99.2 /100 | #90 | Exceptional 2.2% |
| Immigrants | Sudan | 99.1 /100 | #91 | Exceptional 2.2% |
| Chileans | 99.1 /100 | #92 | Exceptional 2.2% |
| Alsatians | 99.0 /100 | #93 | Exceptional 2.1% |
| Greeks | 98.8 /100 | #94 | Exceptional 2.1% |
| Immigrants | Romania | 98.7 /100 | #95 | Exceptional 2.1% |
| Immigrants | Northern Africa | 98.4 /100 | #96 | Exceptional 2.1% |
| Immigrants | Eritrea | 98.4 /100 | #97 | Exceptional 2.1% |
| Armenians | 98.3 /100 | #98 | Exceptional 2.1% |
| Immigrants | Egypt | 98.2 /100 | #99 | Exceptional 2.1% |
| Immigrants | Eastern Europe | 98.2 /100 | #100 | Exceptional 2.1% |
Demographics Similar to Immigrants from Cameroon by Doctorate Degree
In terms of doctorate degree, the demographic groups most similar to Immigrants from Cameroon are Serbian (2.0%, a difference of 0.060%), Immigrants from Uzbekistan (2.0%, a difference of 0.15%), Scottish (2.0%, a difference of 0.20%), Swedish (2.0%, a difference of 0.21%), and South American Indian (2.0%, a difference of 0.21%).
| Demographics | Rating | Rank | Doctorate Degree |
| Palestinians | 92.0 /100 | #127 | Exceptional 2.0% |
| Immigrants | Zaire | 91.1 /100 | #128 | Exceptional 2.0% |
| Canadians | 90.6 /100 | #129 | Exceptional 2.0% |
| Immigrants | Ukraine | 90.5 /100 | #130 | Exceptional 2.0% |
| Immigrants | Sierra Leone | 90.2 /100 | #131 | Exceptional 2.0% |
| Scottish | 89.4 /100 | #132 | Excellent 2.0% |
| Immigrants | Uzbekistan | 89.3 /100 | #133 | Excellent 2.0% |
| Immigrants | Cameroon | 88.9 /100 | #134 | Excellent 2.0% |
| Serbians | 88.7 /100 | #135 | Excellent 2.0% |
| Swedes | 88.3 /100 | #136 | Excellent 2.0% |
| South American Indians | 88.3 /100 | #137 | Excellent 2.0% |
| Swiss | 88.0 /100 | #138 | Excellent 2.0% |
| Afghans | 87.2 /100 | #139 | Excellent 2.0% |
| Immigrants | Africa | 87.0 /100 | #140 | Excellent 2.0% |
| Senegalese | 86.7 /100 | #141 | Excellent 2.0% |