Immigrants from England vs Immigrants from Morocco No Schooling Completed
COMPARE
Immigrants from England
Immigrants from Morocco
No Schooling Completed
No Schooling Completed Comparison
Immigrants from England
Immigrants from Morocco
1.7%
NO SCHOOLING COMPLETED
99.5/ 100
METRIC RATING
71st/ 347
METRIC RANK
2.3%
NO SCHOOLING COMPLETED
8.7/ 100
METRIC RATING
212th/ 347
METRIC RANK
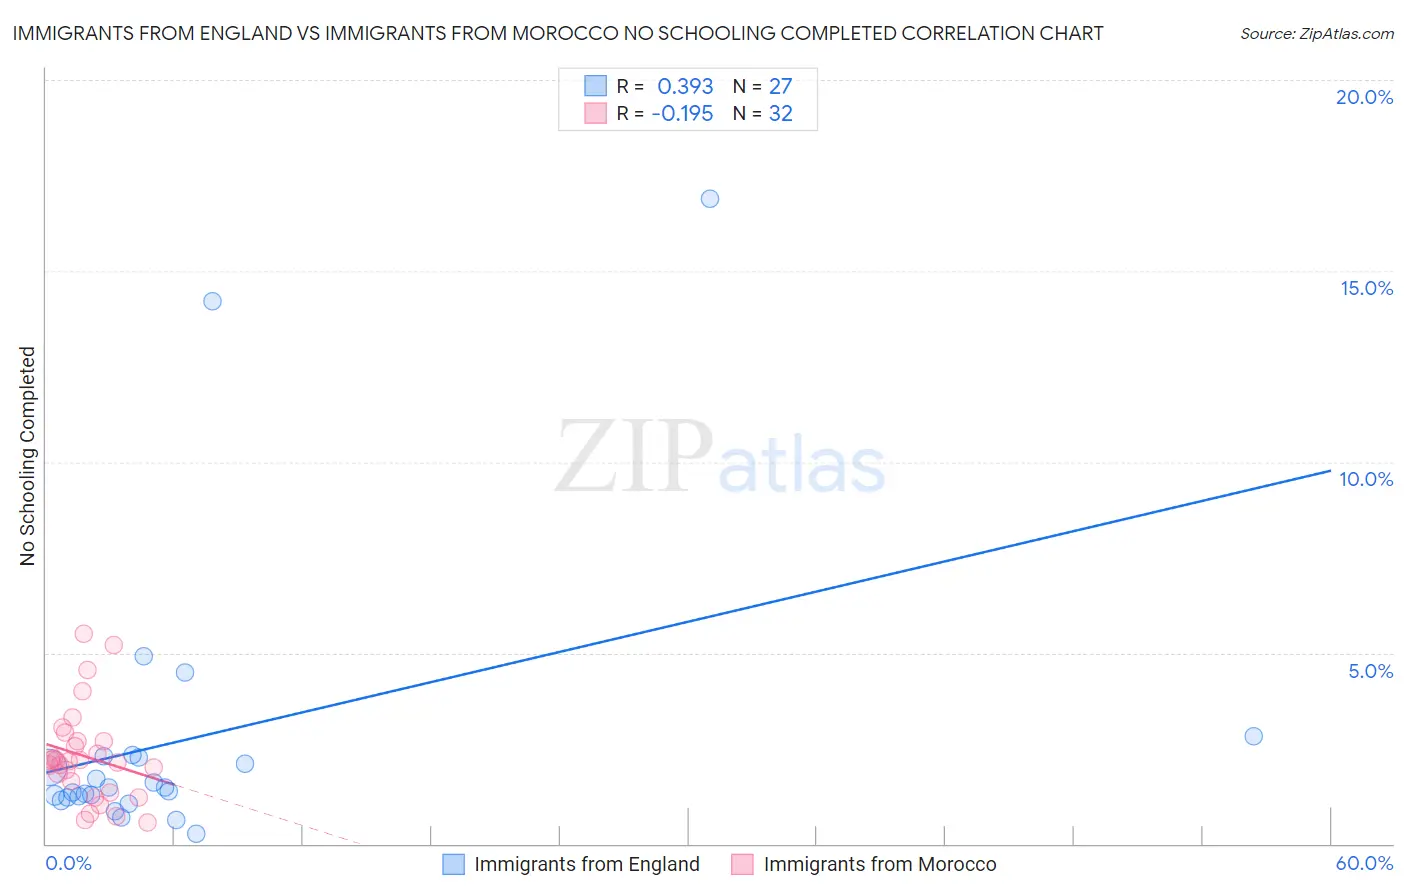
Immigrants from England vs Immigrants from Morocco No Schooling Completed Correlation Chart
The statistical analysis conducted on geographies consisting of 387,063,522 people shows a mild positive correlation between the proportion of Immigrants from England and percentage of population with no schooling in the United States with a correlation coefficient (R) of 0.393 and weighted average of 1.7%. Similarly, the statistical analysis conducted on geographies consisting of 178,575,563 people shows a poor negative correlation between the proportion of Immigrants from Morocco and percentage of population with no schooling in the United States with a correlation coefficient (R) of -0.195 and weighted average of 2.3%, a difference of 31.4%.
No Schooling Completed Correlation Summary
| Measurement | Immigrants from England | Immigrants from Morocco |
| Minimum | 0.25% | 0.54% |
| Maximum | 16.9% | 5.5% |
| Range | 16.7% | 5.0% |
| Mean | 2.7% | 2.3% |
| Median | 1.5% | 2.2% |
| Interquartile 25% (IQ1) | 1.2% | 1.5% |
| Interquartile 75% (IQ3) | 2.3% | 2.7% |
| Interquartile Range (IQR) | 1.1% | 1.2% |
| Standard Deviation (Sample) | 3.8% | 1.2% |
| Standard Deviation (Population) | 3.8% | 1.2% |
Similar Demographics by No Schooling Completed
Demographics Similar to Immigrants from England by No Schooling Completed
In terms of no schooling completed, the demographic groups most similar to Immigrants from England are Cajun (1.7%, a difference of 0.17%), Immigrants from Netherlands (1.7%, a difference of 0.34%), Immigrants from India (1.7%, a difference of 0.65%), Zimbabwean (1.7%, a difference of 0.68%), and Immigrants from Belgium (1.7%, a difference of 1.3%).
| Demographics | Rating | Rank | No Schooling Completed |
| New Zealanders | 99.7 /100 | #64 | Exceptional 1.7% |
| Serbians | 99.7 /100 | #65 | Exceptional 1.7% |
| Canadians | 99.7 /100 | #66 | Exceptional 1.7% |
| Immigrants | Austria | 99.7 /100 | #67 | Exceptional 1.7% |
| Immigrants | Lithuania | 99.7 /100 | #68 | Exceptional 1.7% |
| Chickasaw | 99.6 /100 | #69 | Exceptional 1.7% |
| Immigrants | Netherlands | 99.6 /100 | #70 | Exceptional 1.7% |
| Immigrants | England | 99.5 /100 | #71 | Exceptional 1.7% |
| Cajuns | 99.5 /100 | #72 | Exceptional 1.7% |
| Immigrants | India | 99.4 /100 | #73 | Exceptional 1.7% |
| Zimbabweans | 99.4 /100 | #74 | Exceptional 1.7% |
| Immigrants | Belgium | 99.3 /100 | #75 | Exceptional 1.7% |
| Cherokee | 99.3 /100 | #76 | Exceptional 1.7% |
| Immigrants | Sweden | 99.3 /100 | #77 | Exceptional 1.7% |
| Delaware | 99.3 /100 | #78 | Exceptional 1.7% |
Demographics Similar to Immigrants from Morocco by No Schooling Completed
In terms of no schooling completed, the demographic groups most similar to Immigrants from Morocco are Immigrants from Panama (2.3%, a difference of 0.010%), Ute (2.3%, a difference of 0.19%), Samoan (2.3%, a difference of 0.23%), Native/Alaskan (2.2%, a difference of 0.46%), and Immigrants from Oceania (2.2%, a difference of 0.54%).
| Demographics | Rating | Rank | No Schooling Completed |
| Immigrants | Bahamas | 11.6 /100 | #205 | Poor 2.2% |
| Bahamians | 11.6 /100 | #206 | Poor 2.2% |
| South American Indians | 11.0 /100 | #207 | Poor 2.2% |
| Uruguayans | 11.0 /100 | #208 | Poor 2.2% |
| Immigrants | Oceania | 10.2 /100 | #209 | Poor 2.2% |
| Natives/Alaskans | 10.0 /100 | #210 | Tragic 2.2% |
| Immigrants | Panama | 8.8 /100 | #211 | Tragic 2.3% |
| Immigrants | Morocco | 8.7 /100 | #212 | Tragic 2.3% |
| Ute | 8.2 /100 | #213 | Tragic 2.3% |
| Samoans | 8.2 /100 | #214 | Tragic 2.3% |
| Immigrants | Zaire | 7.2 /100 | #215 | Tragic 2.3% |
| Tongans | 6.8 /100 | #216 | Tragic 2.3% |
| Immigrants | Syria | 6.6 /100 | #217 | Tragic 2.3% |
| Immigrants | Nepal | 6.4 /100 | #218 | Tragic 2.3% |
| Senegalese | 5.6 /100 | #219 | Tragic 2.3% |