Immigrants from England vs Arab No Schooling Completed
COMPARE
Immigrants from England
Arab
No Schooling Completed
No Schooling Completed Comparison
Immigrants from England
Arabs
1.7%
NO SCHOOLING COMPLETED
99.5/ 100
METRIC RATING
71st/ 347
METRIC RANK
2.1%
NO SCHOOLING COMPLETED
46.4/ 100
METRIC RATING
175th/ 347
METRIC RANK
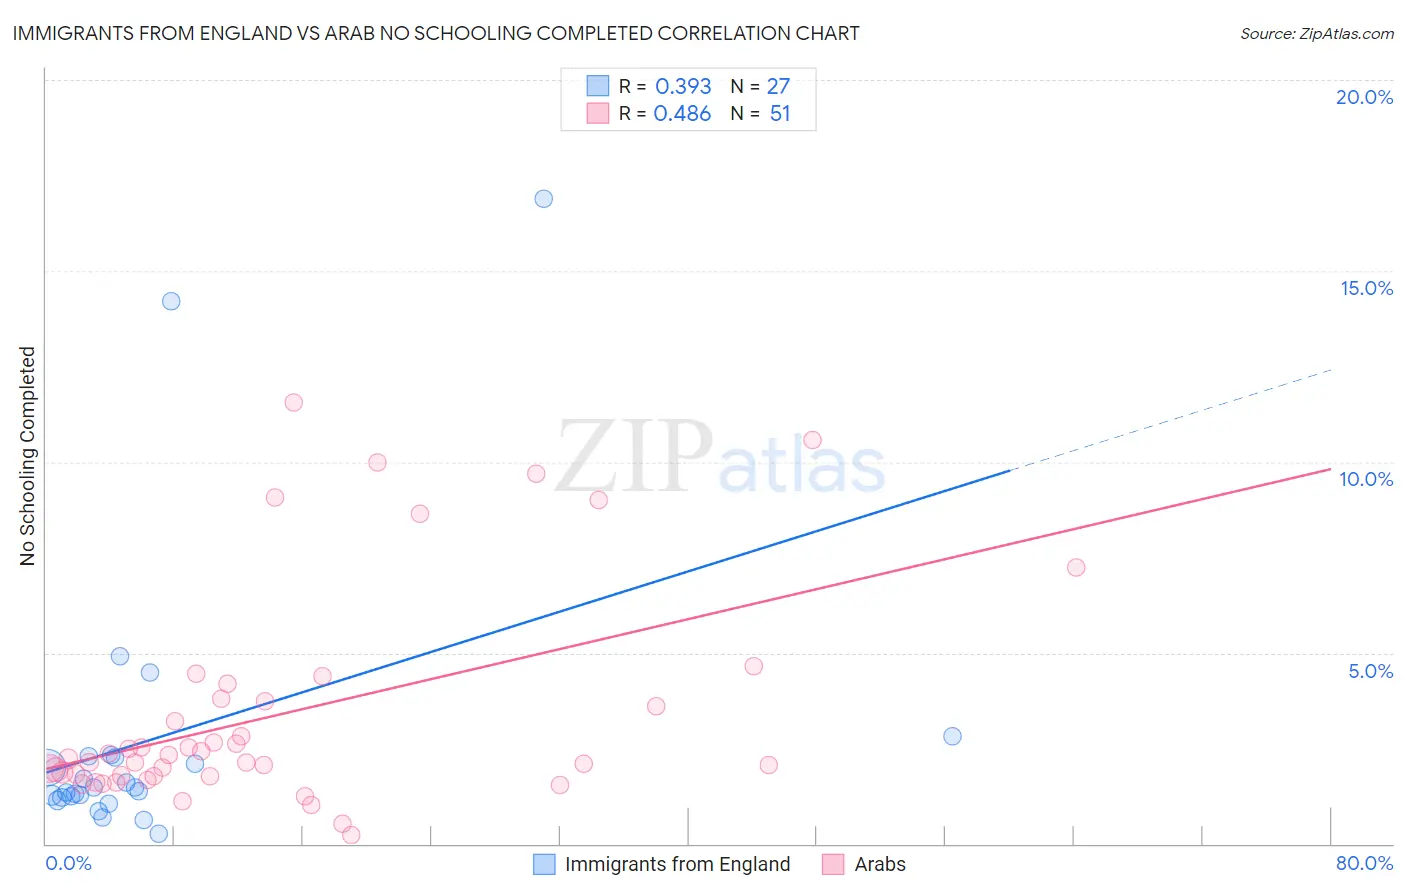
Immigrants from England vs Arab No Schooling Completed Correlation Chart
The statistical analysis conducted on geographies consisting of 387,063,522 people shows a mild positive correlation between the proportion of Immigrants from England and percentage of population with no schooling in the United States with a correlation coefficient (R) of 0.393 and weighted average of 1.7%. Similarly, the statistical analysis conducted on geographies consisting of 479,384,082 people shows a moderate positive correlation between the proportion of Arabs and percentage of population with no schooling in the United States with a correlation coefficient (R) of 0.486 and weighted average of 2.1%, a difference of 22.4%.
No Schooling Completed Correlation Summary
| Measurement | Immigrants from England | Arab |
| Minimum | 0.25% | 0.23% |
| Maximum | 16.9% | 11.6% |
| Range | 16.7% | 11.3% |
| Mean | 2.7% | 3.4% |
| Median | 1.5% | 2.2% |
| Interquartile 25% (IQ1) | 1.2% | 1.8% |
| Interquartile 75% (IQ3) | 2.3% | 3.8% |
| Interquartile Range (IQR) | 1.1% | 2.0% |
| Standard Deviation (Sample) | 3.8% | 2.8% |
| Standard Deviation (Population) | 3.8% | 2.8% |
Similar Demographics by No Schooling Completed
Demographics Similar to Immigrants from England by No Schooling Completed
In terms of no schooling completed, the demographic groups most similar to Immigrants from England are Cajun (1.7%, a difference of 0.17%), Immigrants from Netherlands (1.7%, a difference of 0.34%), Immigrants from India (1.7%, a difference of 0.65%), Zimbabwean (1.7%, a difference of 0.68%), and Immigrants from Belgium (1.7%, a difference of 1.3%).
| Demographics | Rating | Rank | No Schooling Completed |
| New Zealanders | 99.7 /100 | #64 | Exceptional 1.7% |
| Serbians | 99.7 /100 | #65 | Exceptional 1.7% |
| Canadians | 99.7 /100 | #66 | Exceptional 1.7% |
| Immigrants | Austria | 99.7 /100 | #67 | Exceptional 1.7% |
| Immigrants | Lithuania | 99.7 /100 | #68 | Exceptional 1.7% |
| Chickasaw | 99.6 /100 | #69 | Exceptional 1.7% |
| Immigrants | Netherlands | 99.6 /100 | #70 | Exceptional 1.7% |
| Immigrants | England | 99.5 /100 | #71 | Exceptional 1.7% |
| Cajuns | 99.5 /100 | #72 | Exceptional 1.7% |
| Immigrants | India | 99.4 /100 | #73 | Exceptional 1.7% |
| Zimbabweans | 99.4 /100 | #74 | Exceptional 1.7% |
| Immigrants | Belgium | 99.3 /100 | #75 | Exceptional 1.7% |
| Cherokee | 99.3 /100 | #76 | Exceptional 1.7% |
| Immigrants | Sweden | 99.3 /100 | #77 | Exceptional 1.7% |
| Delaware | 99.3 /100 | #78 | Exceptional 1.7% |
Demographics Similar to Arabs by No Schooling Completed
In terms of no schooling completed, the demographic groups most similar to Arabs are Panamanian (2.1%, a difference of 0.17%), Arapaho (2.1%, a difference of 0.19%), Pakistani (2.1%, a difference of 0.23%), Immigrants from Kazakhstan (2.1%, a difference of 0.29%), and Portuguese (2.1%, a difference of 0.35%).
| Demographics | Rating | Rank | No Schooling Completed |
| Cheyenne | 58.6 /100 | #168 | Average 2.1% |
| Apache | 56.7 /100 | #169 | Average 2.1% |
| Argentineans | 56.0 /100 | #170 | Average 2.1% |
| Immigrants | Poland | 55.2 /100 | #171 | Average 2.1% |
| Immigrants | Argentina | 52.7 /100 | #172 | Average 2.1% |
| Immigrants | Belarus | 51.8 /100 | #173 | Average 2.1% |
| Immigrants | Micronesia | 50.0 /100 | #174 | Average 2.1% |
| Arabs | 46.4 /100 | #175 | Average 2.1% |
| Panamanians | 45.2 /100 | #176 | Average 2.1% |
| Arapaho | 45.0 /100 | #177 | Average 2.1% |
| Pakistanis | 44.7 /100 | #178 | Average 2.1% |
| Immigrants | Kazakhstan | 44.3 /100 | #179 | Average 2.1% |
| Portuguese | 43.9 /100 | #180 | Average 2.1% |
| Immigrants | Taiwan | 42.6 /100 | #181 | Average 2.1% |
| French American Indians | 42.2 /100 | #182 | Average 2.1% |