Immigrants from Egypt vs Kiowa College, Under 1 year
COMPARE
Immigrants from Egypt
Kiowa
College, Under 1 year
College, Under 1 year Comparison
Immigrants from Egypt
Kiowa
67.7%
COLLEGE, UNDER 1 YEAR
96.0/ 100
METRIC RATING
108th/ 347
METRIC RANK
57.8%
COLLEGE, UNDER 1 YEAR
0.0/ 100
METRIC RATING
304th/ 347
METRIC RANK
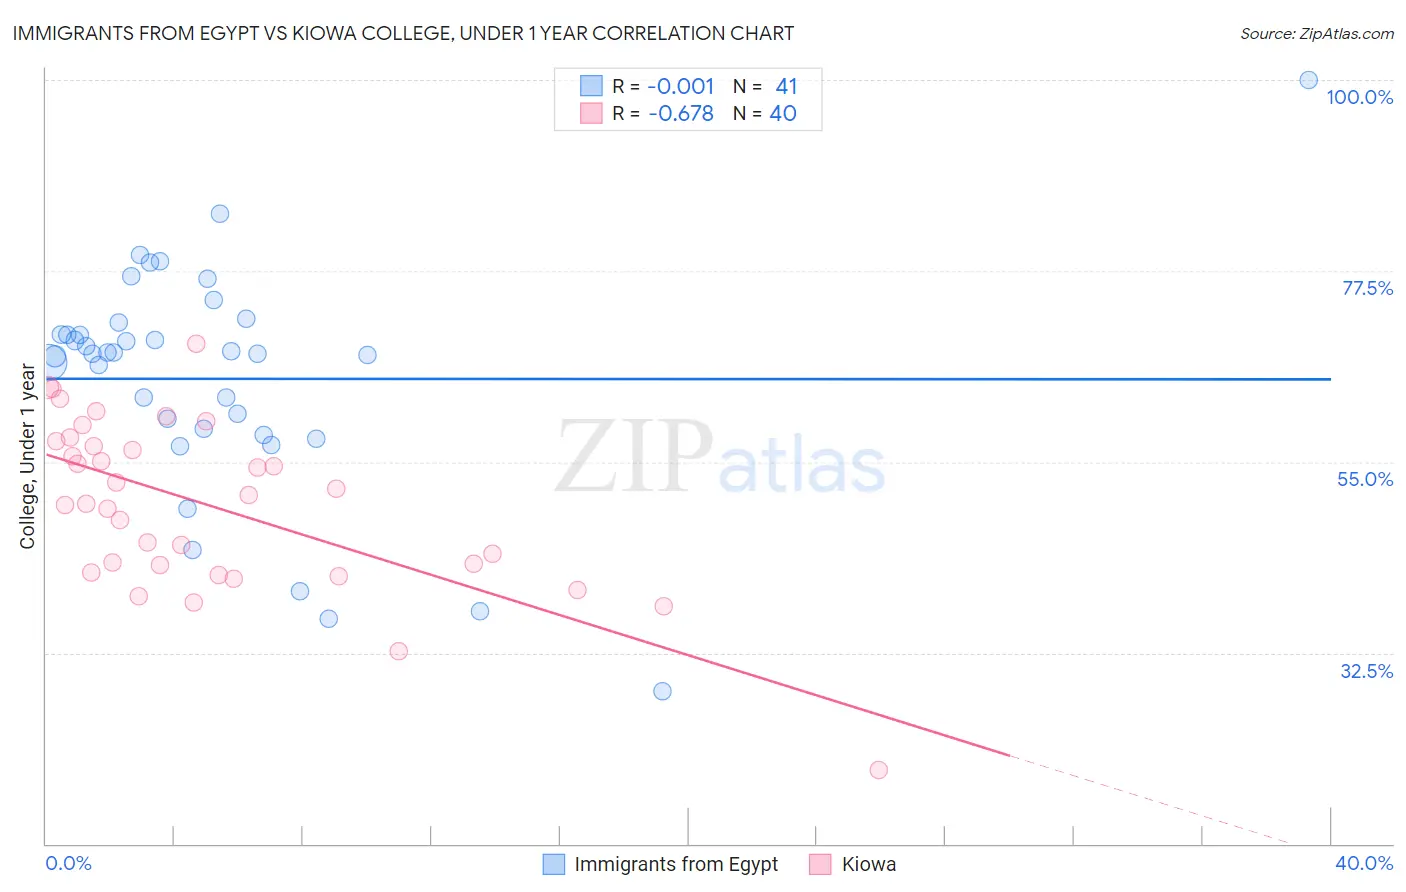
Immigrants from Egypt vs Kiowa College, Under 1 year Correlation Chart
The statistical analysis conducted on geographies consisting of 245,485,794 people shows no correlation between the proportion of Immigrants from Egypt and percentage of population with at least college, under 1 year education in the United States with a correlation coefficient (R) of -0.001 and weighted average of 67.7%. Similarly, the statistical analysis conducted on geographies consisting of 56,101,444 people shows a significant negative correlation between the proportion of Kiowa and percentage of population with at least college, under 1 year education in the United States with a correlation coefficient (R) of -0.678 and weighted average of 57.8%, a difference of 17.0%.
College, Under 1 year Correlation Summary
| Measurement | Immigrants from Egypt | Kiowa |
| Minimum | 28.0% | 18.8% |
| Maximum | 100.0% | 68.9% |
| Range | 72.0% | 50.2% |
| Mean | 64.8% | 49.8% |
| Median | 67.8% | 50.6% |
| Interquartile 25% (IQ1) | 58.6% | 42.4% |
| Interquartile 75% (IQ3) | 70.7% | 57.2% |
| Interquartile Range (IQR) | 12.1% | 14.8% |
| Standard Deviation (Sample) | 13.6% | 10.0% |
| Standard Deviation (Population) | 13.4% | 9.9% |
Similar Demographics by College, Under 1 year
Demographics Similar to Immigrants from Egypt by College, Under 1 year
In terms of college, under 1 year, the demographic groups most similar to Immigrants from Egypt are Scandinavian (67.7%, a difference of 0.060%), Assyrian/Chaldean/Syriac (67.7%, a difference of 0.060%), Ukrainian (67.7%, a difference of 0.060%), Macedonian (67.6%, a difference of 0.080%), and Syrian (67.6%, a difference of 0.11%).
| Demographics | Rating | Rank | College, Under 1 year |
| Immigrants | Eastern Europe | 96.9 /100 | #101 | Exceptional 67.9% |
| Palestinians | 96.9 /100 | #102 | Exceptional 67.9% |
| Carpatho Rusyns | 96.8 /100 | #103 | Exceptional 67.9% |
| Immigrants | Western Asia | 96.6 /100 | #104 | Exceptional 67.8% |
| Afghans | 96.6 /100 | #105 | Exceptional 67.8% |
| Immigrants | Croatia | 96.6 /100 | #106 | Exceptional 67.8% |
| Austrians | 96.4 /100 | #107 | Exceptional 67.8% |
| Immigrants | Egypt | 96.0 /100 | #108 | Exceptional 67.7% |
| Scandinavians | 95.8 /100 | #109 | Exceptional 67.7% |
| Assyrians/Chaldeans/Syriacs | 95.8 /100 | #110 | Exceptional 67.7% |
| Ukrainians | 95.8 /100 | #111 | Exceptional 67.7% |
| Macedonians | 95.7 /100 | #112 | Exceptional 67.6% |
| Syrians | 95.6 /100 | #113 | Exceptional 67.6% |
| Chileans | 95.3 /100 | #114 | Exceptional 67.6% |
| Basques | 95.2 /100 | #115 | Exceptional 67.6% |
Demographics Similar to Kiowa by College, Under 1 year
In terms of college, under 1 year, the demographic groups most similar to Kiowa are Immigrants from Dominica (57.9%, a difference of 0.010%), Haitian (57.8%, a difference of 0.11%), Apache (58.0%, a difference of 0.30%), Immigrants from Portugal (57.7%, a difference of 0.31%), and Fijian (57.7%, a difference of 0.32%).
| Demographics | Rating | Rank | College, Under 1 year |
| Guyanese | 0.0 /100 | #297 | Tragic 59.0% |
| Immigrants | Ecuador | 0.0 /100 | #298 | Tragic 58.7% |
| Cubans | 0.0 /100 | #299 | Tragic 58.6% |
| Immigrants | Guyana | 0.0 /100 | #300 | Tragic 58.5% |
| Mexican American Indians | 0.0 /100 | #301 | Tragic 58.1% |
| Apache | 0.0 /100 | #302 | Tragic 58.0% |
| Immigrants | Dominica | 0.0 /100 | #303 | Tragic 57.9% |
| Kiowa | 0.0 /100 | #304 | Tragic 57.8% |
| Haitians | 0.0 /100 | #305 | Tragic 57.8% |
| Immigrants | Portugal | 0.0 /100 | #306 | Tragic 57.7% |
| Fijians | 0.0 /100 | #307 | Tragic 57.7% |
| Central Americans | 0.0 /100 | #308 | Tragic 57.7% |
| Immigrants | Nicaragua | 0.0 /100 | #309 | Tragic 57.6% |
| Pueblo | 0.0 /100 | #310 | Tragic 57.4% |
| Cajuns | 0.0 /100 | #311 | Tragic 57.3% |