Immigrants from Egypt vs Immigrants from Poland College, Under 1 year
COMPARE
Immigrants from Egypt
Immigrants from Poland
College, Under 1 year
College, Under 1 year Comparison
Immigrants from Egypt
Immigrants from Poland
67.7%
COLLEGE, UNDER 1 YEAR
96.0/ 100
METRIC RATING
108th/ 347
METRIC RANK
65.2%
COLLEGE, UNDER 1 YEAR
42.6/ 100
METRIC RATING
183rd/ 347
METRIC RANK
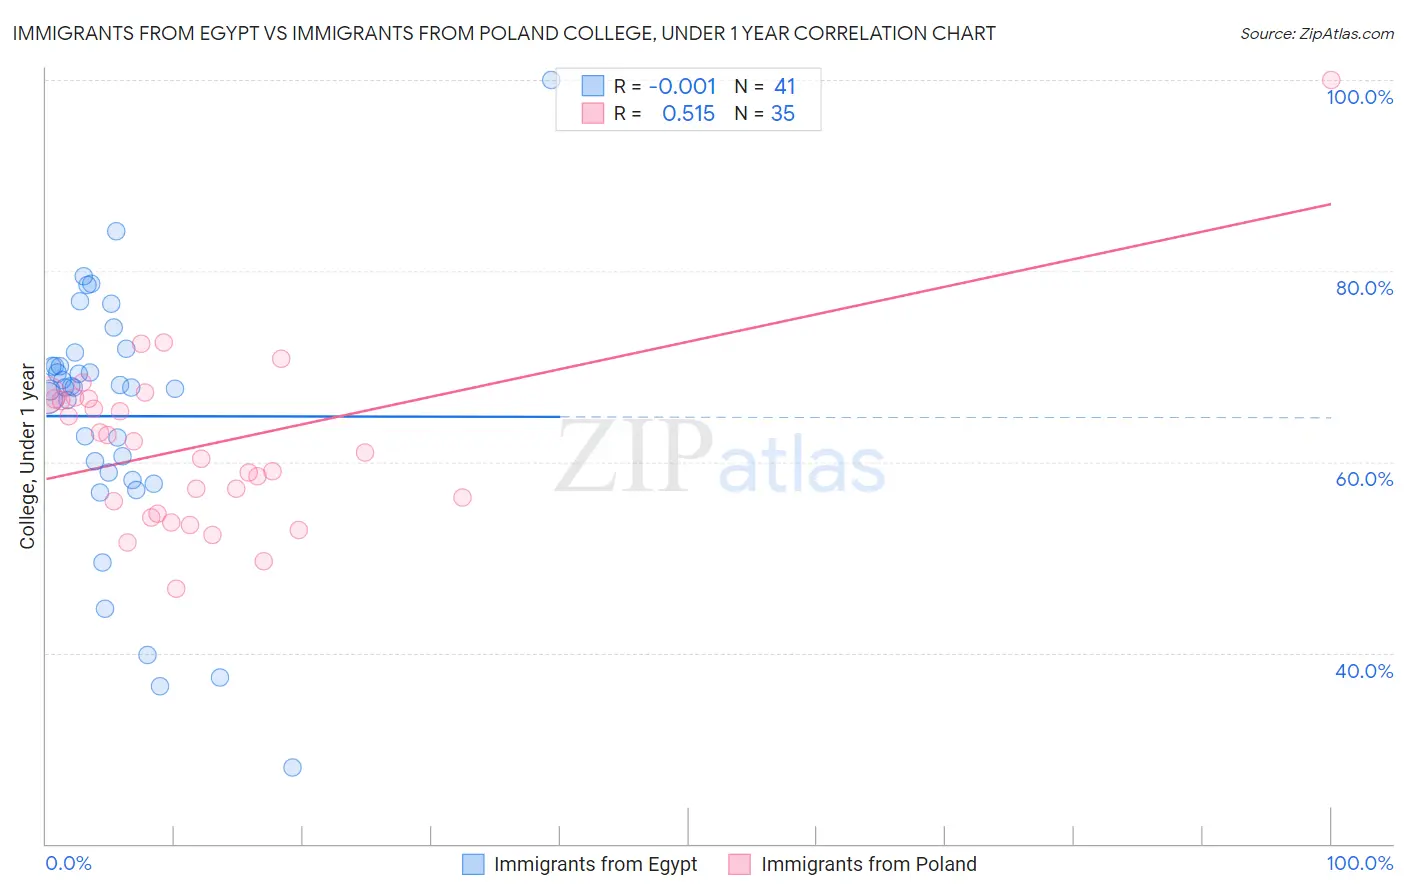
Immigrants from Egypt vs Immigrants from Poland College, Under 1 year Correlation Chart
The statistical analysis conducted on geographies consisting of 245,485,794 people shows no correlation between the proportion of Immigrants from Egypt and percentage of population with at least college, under 1 year education in the United States with a correlation coefficient (R) of -0.001 and weighted average of 67.7%. Similarly, the statistical analysis conducted on geographies consisting of 304,861,877 people shows a substantial positive correlation between the proportion of Immigrants from Poland and percentage of population with at least college, under 1 year education in the United States with a correlation coefficient (R) of 0.515 and weighted average of 65.2%, a difference of 3.8%.
College, Under 1 year Correlation Summary
| Measurement | Immigrants from Egypt | Immigrants from Poland |
| Minimum | 28.0% | 46.7% |
| Maximum | 100.0% | 100.0% |
| Range | 72.0% | 53.3% |
| Mean | 64.8% | 61.8% |
| Median | 67.8% | 61.0% |
| Interquartile 25% (IQ1) | 58.6% | 54.6% |
| Interquartile 75% (IQ3) | 70.7% | 66.6% |
| Interquartile Range (IQR) | 12.1% | 12.0% |
| Standard Deviation (Sample) | 13.6% | 9.4% |
| Standard Deviation (Population) | 13.4% | 9.3% |
Similar Demographics by College, Under 1 year
Demographics Similar to Immigrants from Egypt by College, Under 1 year
In terms of college, under 1 year, the demographic groups most similar to Immigrants from Egypt are Scandinavian (67.7%, a difference of 0.060%), Assyrian/Chaldean/Syriac (67.7%, a difference of 0.060%), Ukrainian (67.7%, a difference of 0.060%), Macedonian (67.6%, a difference of 0.080%), and Syrian (67.6%, a difference of 0.11%).
| Demographics | Rating | Rank | College, Under 1 year |
| Immigrants | Eastern Europe | 96.9 /100 | #101 | Exceptional 67.9% |
| Palestinians | 96.9 /100 | #102 | Exceptional 67.9% |
| Carpatho Rusyns | 96.8 /100 | #103 | Exceptional 67.9% |
| Immigrants | Western Asia | 96.6 /100 | #104 | Exceptional 67.8% |
| Afghans | 96.6 /100 | #105 | Exceptional 67.8% |
| Immigrants | Croatia | 96.6 /100 | #106 | Exceptional 67.8% |
| Austrians | 96.4 /100 | #107 | Exceptional 67.8% |
| Immigrants | Egypt | 96.0 /100 | #108 | Exceptional 67.7% |
| Scandinavians | 95.8 /100 | #109 | Exceptional 67.7% |
| Assyrians/Chaldeans/Syriacs | 95.8 /100 | #110 | Exceptional 67.7% |
| Ukrainians | 95.8 /100 | #111 | Exceptional 67.7% |
| Macedonians | 95.7 /100 | #112 | Exceptional 67.6% |
| Syrians | 95.6 /100 | #113 | Exceptional 67.6% |
| Chileans | 95.3 /100 | #114 | Exceptional 67.6% |
| Basques | 95.2 /100 | #115 | Exceptional 67.6% |
Demographics Similar to Immigrants from Poland by College, Under 1 year
In terms of college, under 1 year, the demographic groups most similar to Immigrants from Poland are Bermudan (65.2%, a difference of 0.030%), Sri Lankan (65.2%, a difference of 0.040%), Immigrants from Africa (65.3%, a difference of 0.10%), Spaniard (65.3%, a difference of 0.13%), and Immigrants from Sierra Leone (65.1%, a difference of 0.13%).
| Demographics | Rating | Rank | College, Under 1 year |
| French | 48.9 /100 | #176 | Average 65.4% |
| Immigrants | North Macedonia | 48.6 /100 | #177 | Average 65.4% |
| German Russians | 48.3 /100 | #178 | Average 65.4% |
| Guamanians/Chamorros | 48.2 /100 | #179 | Average 65.4% |
| Dutch | 46.1 /100 | #180 | Average 65.3% |
| Spaniards | 45.5 /100 | #181 | Average 65.3% |
| Immigrants | Africa | 44.7 /100 | #182 | Average 65.3% |
| Immigrants | Poland | 42.6 /100 | #183 | Average 65.2% |
| Bermudans | 42.0 /100 | #184 | Average 65.2% |
| Sri Lankans | 41.7 /100 | #185 | Average 65.2% |
| Immigrants | Sierra Leone | 39.7 /100 | #186 | Fair 65.1% |
| Immigrants | Southern Europe | 34.3 /100 | #187 | Fair 64.9% |
| Immigrants | Albania | 32.0 /100 | #188 | Fair 64.9% |
| Spanish | 31.6 /100 | #189 | Fair 64.9% |
| Immigrants | Philippines | 30.1 /100 | #190 | Fair 64.8% |