Immigrants from Egypt vs Iraqi 6th Grade
COMPARE
Immigrants from Egypt
Iraqi
6th Grade
6th Grade Comparison
Immigrants from Egypt
Iraqis
97.0%
6TH GRADE
31.4/ 100
METRIC RATING
186th/ 347
METRIC RANK
96.8%
6TH GRADE
11.7/ 100
METRIC RATING
207th/ 347
METRIC RANK
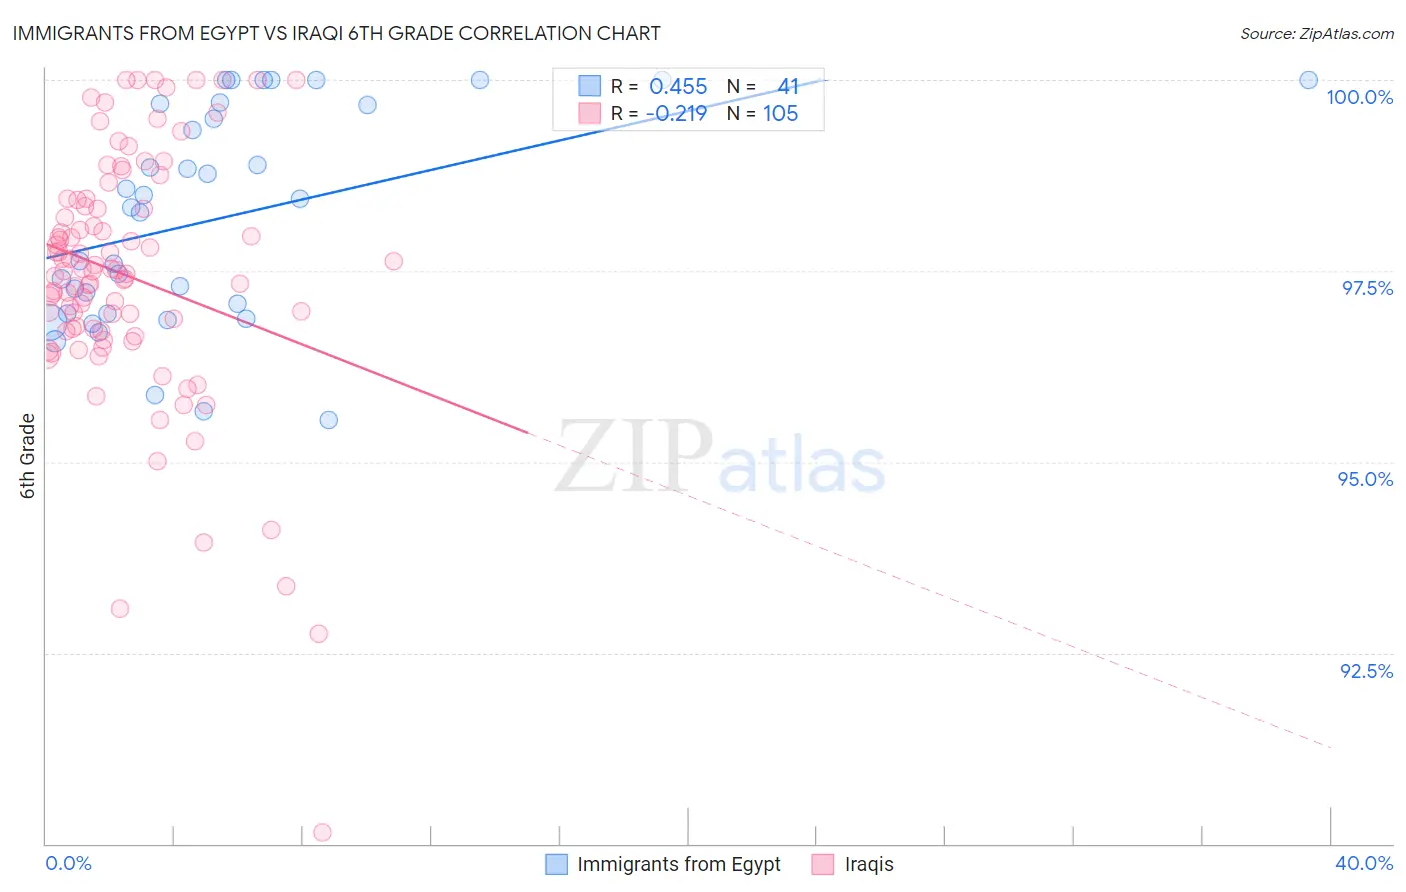
Immigrants from Egypt vs Iraqi 6th Grade Correlation Chart
The statistical analysis conducted on geographies consisting of 245,485,794 people shows a moderate positive correlation between the proportion of Immigrants from Egypt and percentage of population with at least 6th grade education in the United States with a correlation coefficient (R) of 0.455 and weighted average of 97.0%. Similarly, the statistical analysis conducted on geographies consisting of 170,614,457 people shows a weak negative correlation between the proportion of Iraqis and percentage of population with at least 6th grade education in the United States with a correlation coefficient (R) of -0.219 and weighted average of 96.8%, a difference of 0.14%.
6th Grade Correlation Summary
| Measurement | Immigrants from Egypt | Iraqi |
| Minimum | 95.5% | 90.1% |
| Maximum | 100.0% | 100.0% |
| Range | 4.5% | 9.9% |
| Mean | 98.2% | 97.4% |
| Median | 98.3% | 97.5% |
| Interquartile 25% (IQ1) | 96.9% | 96.7% |
| Interquartile 75% (IQ3) | 99.7% | 98.4% |
| Interquartile Range (IQR) | 2.7% | 1.7% |
| Standard Deviation (Sample) | 1.4% | 1.7% |
| Standard Deviation (Population) | 1.4% | 1.6% |
Similar Demographics by 6th Grade
Demographics Similar to Immigrants from Egypt by 6th Grade
In terms of 6th grade, the demographic groups most similar to Immigrants from Egypt are Guamanian/Chamorro (97.0%, a difference of 0.0%), Spanish American (97.0%, a difference of 0.010%), Argentinean (97.0%, a difference of 0.010%), Immigrants from Argentina (97.0%, a difference of 0.010%), and Black/African American (97.0%, a difference of 0.010%).
| Demographics | Rating | Rank | 6th Grade |
| Immigrants | Kenya | 45.3 /100 | #179 | Average 97.0% |
| Immigrants | Spain | 39.9 /100 | #180 | Fair 97.0% |
| Comanche | 37.9 /100 | #181 | Fair 97.0% |
| Immigrants | Ukraine | 35.6 /100 | #182 | Fair 97.0% |
| Immigrants | Venezuela | 34.5 /100 | #183 | Fair 97.0% |
| Spanish Americans | 33.5 /100 | #184 | Fair 97.0% |
| Argentineans | 33.0 /100 | #185 | Fair 97.0% |
| Immigrants | Egypt | 31.4 /100 | #186 | Fair 97.0% |
| Guamanians/Chamorros | 30.6 /100 | #187 | Fair 97.0% |
| Immigrants | Argentina | 30.4 /100 | #188 | Fair 97.0% |
| Blacks/African Americans | 30.2 /100 | #189 | Fair 97.0% |
| Dutch West Indians | 28.3 /100 | #190 | Fair 96.9% |
| Panamanians | 27.3 /100 | #191 | Fair 96.9% |
| Hawaiians | 27.0 /100 | #192 | Fair 96.9% |
| Paraguayans | 26.6 /100 | #193 | Fair 96.9% |
Demographics Similar to Iraqis by 6th Grade
In terms of 6th grade, the demographic groups most similar to Iraqis are Laotian (96.8%, a difference of 0.0%), Native/Alaskan (96.8%, a difference of 0.010%), Samoan (96.8%, a difference of 0.010%), Immigrants from Oceania (96.8%, a difference of 0.010%), and Immigrants from Chile (96.8%, a difference of 0.020%).
| Demographics | Rating | Rank | 6th Grade |
| Africans | 14.8 /100 | #200 | Poor 96.9% |
| Immigrants | Zaire | 14.5 /100 | #201 | Poor 96.9% |
| Immigrants | Chile | 14.2 /100 | #202 | Poor 96.8% |
| Sudanese | 13.9 /100 | #203 | Poor 96.8% |
| Immigrants | Bahamas | 13.8 /100 | #204 | Poor 96.8% |
| Natives/Alaskans | 13.0 /100 | #205 | Poor 96.8% |
| Laotians | 11.8 /100 | #206 | Poor 96.8% |
| Iraqis | 11.7 /100 | #207 | Poor 96.8% |
| Samoans | 11.0 /100 | #208 | Poor 96.8% |
| Immigrants | Oceania | 11.0 /100 | #209 | Poor 96.8% |
| Immigrants | Nepal | 10.1 /100 | #210 | Poor 96.8% |
| Immigrants | Iraq | 9.2 /100 | #211 | Tragic 96.8% |
| Moroccans | 9.0 /100 | #212 | Tragic 96.8% |
| Immigrants | Sudan | 8.7 /100 | #213 | Tragic 96.8% |
| Portuguese | 8.2 /100 | #214 | Tragic 96.8% |