Immigrants from Egypt vs Immigrants from Italy 6th Grade
COMPARE
Immigrants from Egypt
Immigrants from Italy
6th Grade
6th Grade Comparison
Immigrants from Egypt
Immigrants from Italy
97.0%
6TH GRADE
31.4/ 100
METRIC RATING
186th/ 347
METRIC RANK
97.1%
6TH GRADE
53.8/ 100
METRIC RATING
166th/ 347
METRIC RANK
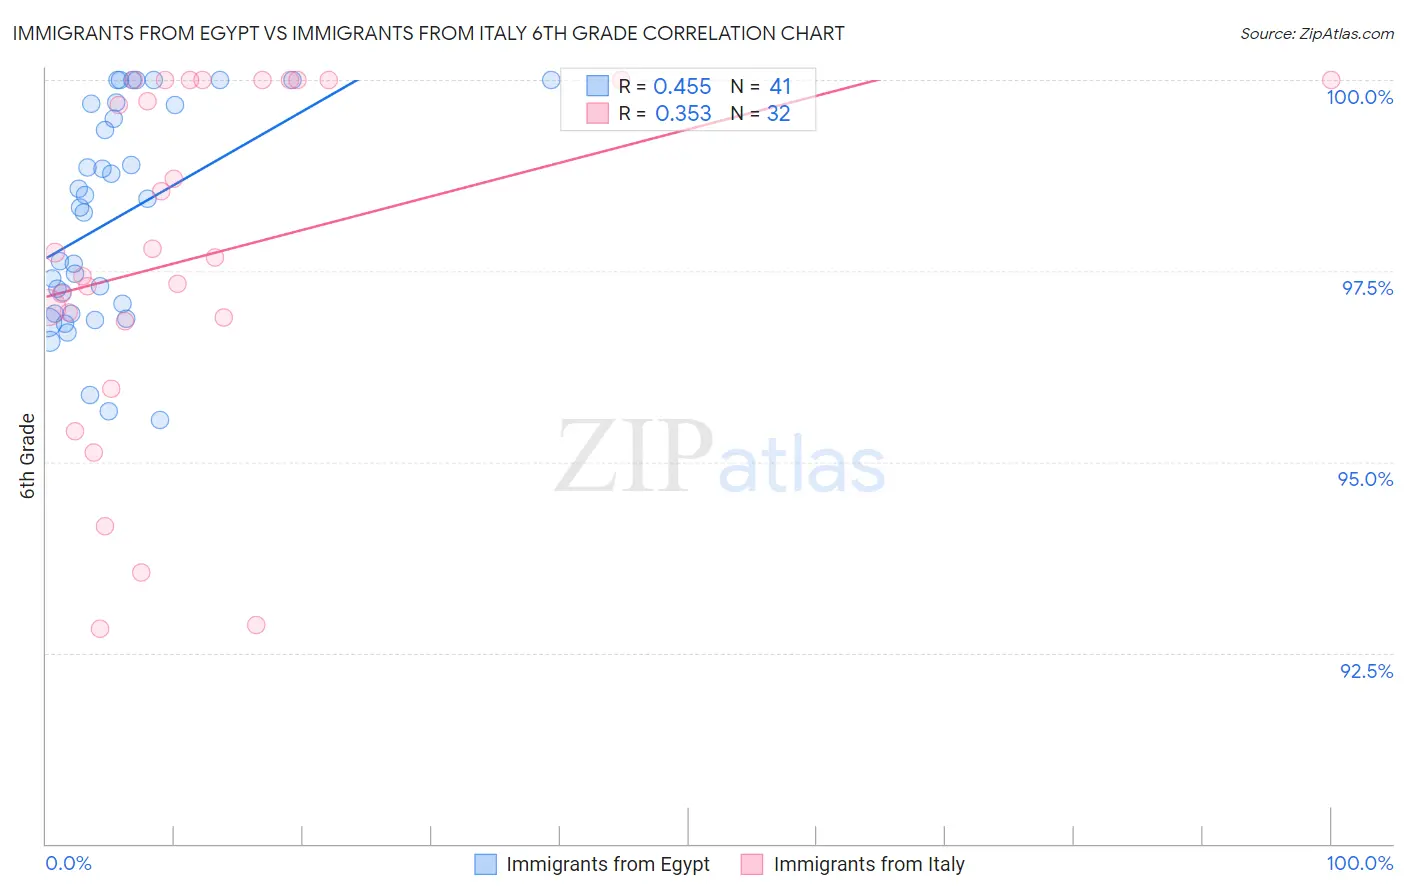
Immigrants from Egypt vs Immigrants from Italy 6th Grade Correlation Chart
The statistical analysis conducted on geographies consisting of 245,485,794 people shows a moderate positive correlation between the proportion of Immigrants from Egypt and percentage of population with at least 6th grade education in the United States with a correlation coefficient (R) of 0.455 and weighted average of 97.0%. Similarly, the statistical analysis conducted on geographies consisting of 324,226,009 people shows a mild positive correlation between the proportion of Immigrants from Italy and percentage of population with at least 6th grade education in the United States with a correlation coefficient (R) of 0.353 and weighted average of 97.1%, a difference of 0.11%.
6th Grade Correlation Summary
| Measurement | Immigrants from Egypt | Immigrants from Italy |
| Minimum | 95.5% | 92.8% |
| Maximum | 100.0% | 100.0% |
| Range | 4.5% | 7.2% |
| Mean | 98.2% | 97.7% |
| Median | 98.3% | 97.7% |
| Interquartile 25% (IQ1) | 96.9% | 96.9% |
| Interquartile 75% (IQ3) | 99.7% | 100.0% |
| Interquartile Range (IQR) | 2.7% | 3.1% |
| Standard Deviation (Sample) | 1.4% | 2.3% |
| Standard Deviation (Population) | 1.4% | 2.2% |
Demographics Similar to Immigrants from Egypt and Immigrants from Italy by 6th Grade
In terms of 6th grade, the demographic groups most similar to Immigrants from Egypt are Spanish American (97.0%, a difference of 0.010%), Argentinean (97.0%, a difference of 0.010%), Immigrants from Ukraine (97.0%, a difference of 0.020%), Immigrants from Venezuela (97.0%, a difference of 0.020%), and Comanche (97.0%, a difference of 0.030%). Similarly, the demographic groups most similar to Immigrants from Italy are Apache (97.1%, a difference of 0.0%), Immigrants from Taiwan (97.1%, a difference of 0.0%), Bermudan (97.1%, a difference of 0.010%), Chilean (97.1%, a difference of 0.010%), and Immigrants from Sri Lanka (97.1%, a difference of 0.010%).
| Demographics | Rating | Rank | 6th Grade |
| Immigrants | Italy | 53.8 /100 | #166 | Average 97.1% |
| Apache | 53.6 /100 | #167 | Average 97.1% |
| Immigrants | Taiwan | 53.5 /100 | #168 | Average 97.1% |
| Bermudans | 52.6 /100 | #169 | Average 97.1% |
| Chileans | 52.1 /100 | #170 | Average 97.1% |
| Immigrants | Sri Lanka | 51.7 /100 | #171 | Average 97.1% |
| Egyptians | 50.9 /100 | #172 | Average 97.1% |
| Arabs | 50.1 /100 | #173 | Average 97.0% |
| Venezuelans | 50.0 /100 | #174 | Average 97.0% |
| Immigrants | Kazakhstan | 47.3 /100 | #175 | Average 97.0% |
| Immigrants | Micronesia | 47.1 /100 | #176 | Average 97.0% |
| Mongolians | 46.7 /100 | #177 | Average 97.0% |
| Pakistanis | 46.0 /100 | #178 | Average 97.0% |
| Immigrants | Kenya | 45.3 /100 | #179 | Average 97.0% |
| Immigrants | Spain | 39.9 /100 | #180 | Fair 97.0% |
| Comanche | 37.9 /100 | #181 | Fair 97.0% |
| Immigrants | Ukraine | 35.6 /100 | #182 | Fair 97.0% |
| Immigrants | Venezuela | 34.5 /100 | #183 | Fair 97.0% |
| Spanish Americans | 33.5 /100 | #184 | Fair 97.0% |
| Argentineans | 33.0 /100 | #185 | Fair 97.0% |
| Immigrants | Egypt | 31.4 /100 | #186 | Fair 97.0% |