Immigrants from Egypt vs Immigrants from Peru GED/Equivalency
COMPARE
Immigrants from Egypt
Immigrants from Peru
GED/Equivalency
GED/Equivalency Comparison
Immigrants from Egypt
Immigrants from Peru
86.7%
GED/EQUIVALENCY
90.4/ 100
METRIC RATING
124th/ 347
METRIC RANK
84.2%
GED/EQUIVALENCY
2.7/ 100
METRIC RATING
238th/ 347
METRIC RANK
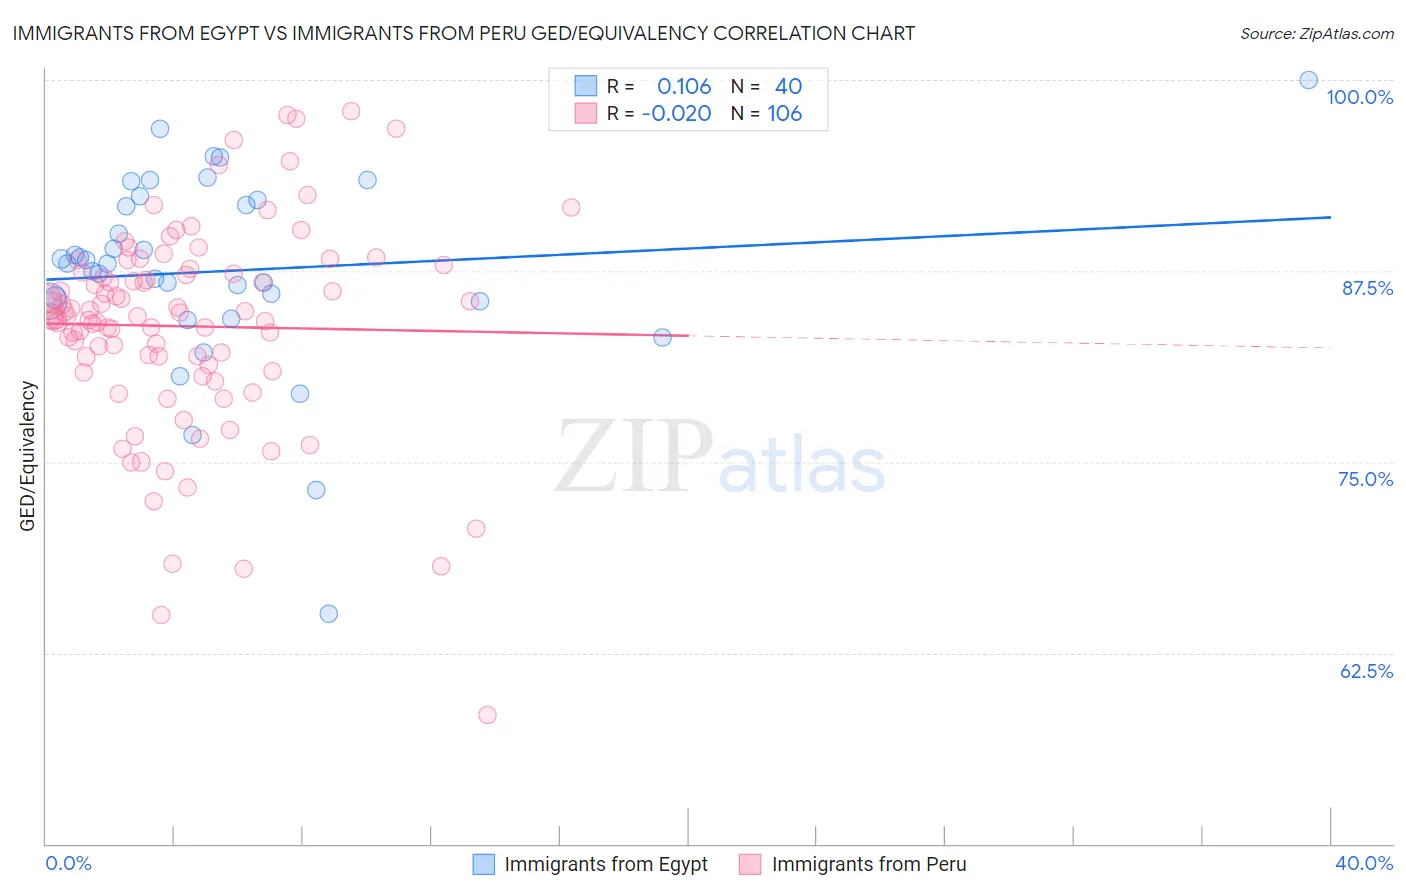
Immigrants from Egypt vs Immigrants from Peru GED/Equivalency Correlation Chart
The statistical analysis conducted on geographies consisting of 245,485,633 people shows a poor positive correlation between the proportion of Immigrants from Egypt and percentage of population with at least ged/equivalency education in the United States with a correlation coefficient (R) of 0.106 and weighted average of 86.7%. Similarly, the statistical analysis conducted on geographies consisting of 328,860,880 people shows no correlation between the proportion of Immigrants from Peru and percentage of population with at least ged/equivalency education in the United States with a correlation coefficient (R) of -0.020 and weighted average of 84.2%, a difference of 3.0%.
GED/Equivalency Correlation Summary
| Measurement | Immigrants from Egypt | Immigrants from Peru |
| Minimum | 65.1% | 58.5% |
| Maximum | 100.0% | 97.9% |
| Range | 34.9% | 39.5% |
| Mean | 87.5% | 83.9% |
| Median | 88.0% | 84.6% |
| Interquartile 25% (IQ1) | 85.5% | 81.3% |
| Interquartile 75% (IQ3) | 92.0% | 87.4% |
| Interquartile Range (IQR) | 6.5% | 6.1% |
| Standard Deviation (Sample) | 6.4% | 6.8% |
| Standard Deviation (Population) | 6.3% | 6.8% |
Similar Demographics by GED/Equivalency
Demographics Similar to Immigrants from Egypt by GED/Equivalency
In terms of ged/equivalency, the demographic groups most similar to Immigrants from Egypt are Celtic (86.7%, a difference of 0.0%), Immigrants from Italy (86.7%, a difference of 0.010%), Asian (86.7%, a difference of 0.010%), Immigrants from Lebanon (86.8%, a difference of 0.030%), and Immigrants from Jordan (86.8%, a difference of 0.030%).
| Demographics | Rating | Rank | GED/Equivalency |
| Immigrants | Hong Kong | 93.8 /100 | #117 | Exceptional 86.9% |
| French Canadians | 93.2 /100 | #118 | Exceptional 86.9% |
| Immigrants | China | 93.2 /100 | #119 | Exceptional 86.9% |
| Scotch-Irish | 91.6 /100 | #120 | Exceptional 86.8% |
| Immigrants | Lebanon | 90.9 /100 | #121 | Exceptional 86.8% |
| Immigrants | Jordan | 90.8 /100 | #122 | Exceptional 86.8% |
| Immigrants | Italy | 90.5 /100 | #123 | Exceptional 86.7% |
| Immigrants | Egypt | 90.4 /100 | #124 | Exceptional 86.7% |
| Celtics | 90.4 /100 | #125 | Exceptional 86.7% |
| Asians | 90.3 /100 | #126 | Exceptional 86.7% |
| Argentineans | 89.7 /100 | #127 | Excellent 86.7% |
| Yugoslavians | 89.5 /100 | #128 | Excellent 86.7% |
| Immigrants | Ukraine | 88.9 /100 | #129 | Excellent 86.7% |
| Immigrants | Germany | 88.8 /100 | #130 | Excellent 86.7% |
| Immigrants | Spain | 88.5 /100 | #131 | Excellent 86.7% |
Demographics Similar to Immigrants from Peru by GED/Equivalency
In terms of ged/equivalency, the demographic groups most similar to Immigrants from Peru are Immigrants from Bahamas (84.2%, a difference of 0.030%), Immigrants from South Eastern Asia (84.1%, a difference of 0.040%), Subsaharan African (84.2%, a difference of 0.060%), Ghanaian (84.3%, a difference of 0.13%), and Immigrants from Eritrea (84.3%, a difference of 0.13%).
| Demographics | Rating | Rank | GED/Equivalency |
| Immigrants | Middle Africa | 4.3 /100 | #231 | Tragic 84.4% |
| Immigrants | South America | 4.2 /100 | #232 | Tragic 84.4% |
| Immigrants | Panama | 4.1 /100 | #233 | Tragic 84.4% |
| Immigrants | Nigeria | 3.6 /100 | #234 | Tragic 84.3% |
| Ghanaians | 3.5 /100 | #235 | Tragic 84.3% |
| Immigrants | Eritrea | 3.5 /100 | #236 | Tragic 84.3% |
| Sub-Saharan Africans | 3.0 /100 | #237 | Tragic 84.2% |
| Immigrants | Peru | 2.7 /100 | #238 | Tragic 84.2% |
| Immigrants | Bahamas | 2.6 /100 | #239 | Tragic 84.2% |
| Immigrants | South Eastern Asia | 2.5 /100 | #240 | Tragic 84.1% |
| Senegalese | 1.9 /100 | #241 | Tragic 84.0% |
| Sri Lankans | 1.9 /100 | #242 | Tragic 84.0% |
| Cherokee | 1.3 /100 | #243 | Tragic 83.9% |
| Immigrants | Ghana | 1.3 /100 | #244 | Tragic 83.9% |
| Immigrants | Senegal | 1.2 /100 | #245 | Tragic 83.8% |