Immigrants from Eastern Europe vs Cree College, 1 year or more
COMPARE
Immigrants from Eastern Europe
Cree
College, 1 year or more
College, 1 year or more Comparison
Immigrants from Eastern Europe
Cree
62.4%
COLLEGE, 1 YEAR OR MORE
97.8/ 100
METRIC RATING
91st/ 347
METRIC RANK
56.8%
COLLEGE, 1 YEAR OR MORE
3.6/ 100
METRIC RATING
229th/ 347
METRIC RANK
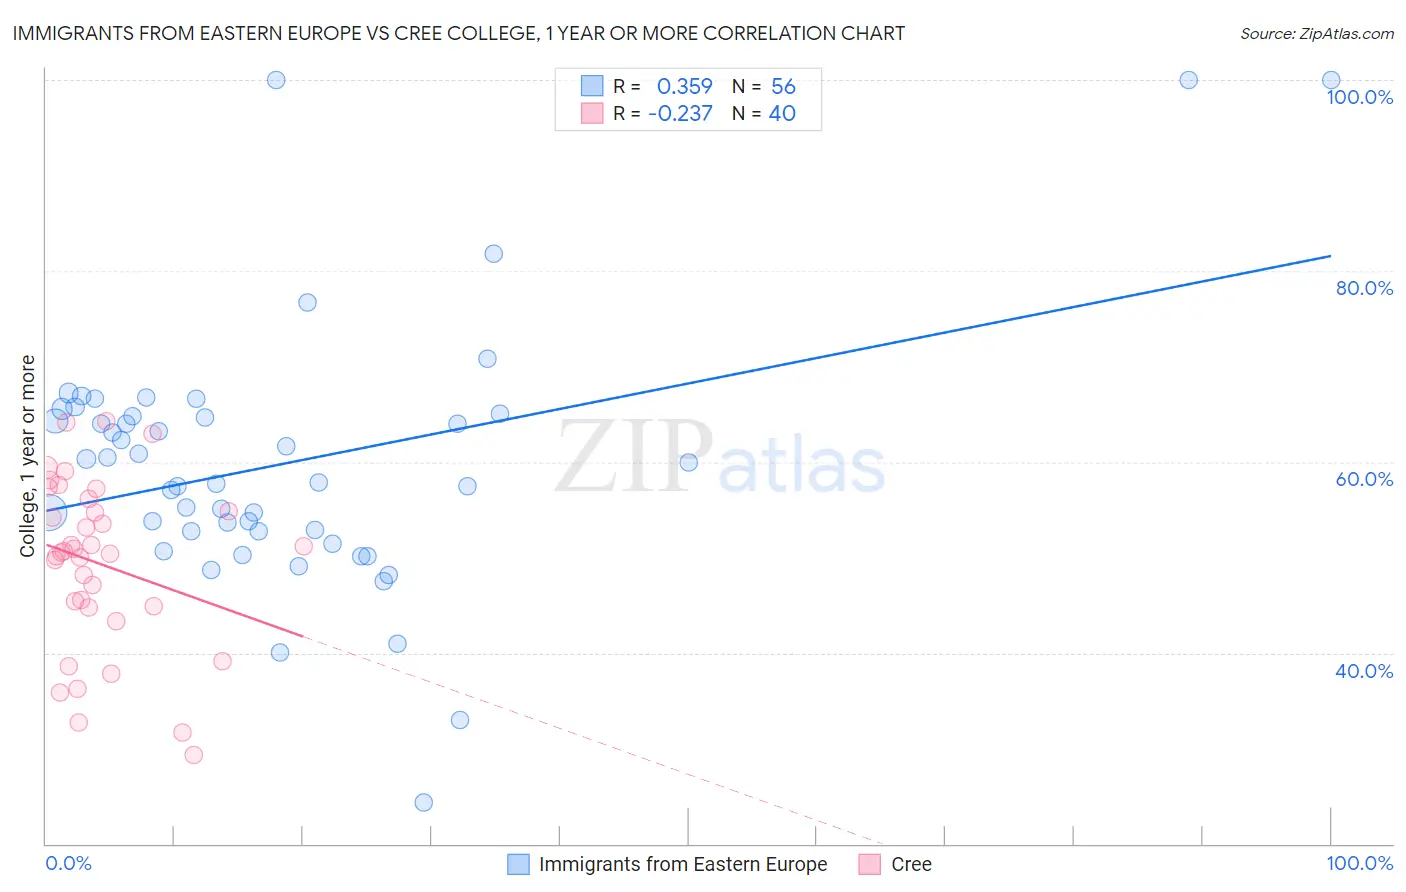
Immigrants from Eastern Europe vs Cree College, 1 year or more Correlation Chart
The statistical analysis conducted on geographies consisting of 475,874,060 people shows a mild positive correlation between the proportion of Immigrants from Eastern Europe and percentage of population with at least college, 1 year or more education in the United States with a correlation coefficient (R) of 0.359 and weighted average of 62.4%. Similarly, the statistical analysis conducted on geographies consisting of 76,211,685 people shows a weak negative correlation between the proportion of Cree and percentage of population with at least college, 1 year or more education in the United States with a correlation coefficient (R) of -0.237 and weighted average of 56.8%, a difference of 9.8%.
College, 1 year or more Correlation Summary
| Measurement | Immigrants from Eastern Europe | Cree |
| Minimum | 24.4% | 29.2% |
| Maximum | 100.0% | 64.2% |
| Range | 75.6% | 35.0% |
| Mean | 59.8% | 49.3% |
| Median | 58.9% | 50.6% |
| Interquartile 25% (IQ1) | 52.7% | 44.8% |
| Interquartile 75% (IQ3) | 64.9% | 55.5% |
| Interquartile Range (IQR) | 12.2% | 10.7% |
| Standard Deviation (Sample) | 13.7% | 8.9% |
| Standard Deviation (Population) | 13.6% | 8.8% |
Similar Demographics by College, 1 year or more
Demographics Similar to Immigrants from Eastern Europe by College, 1 year or more
In terms of college, 1 year or more, the demographic groups most similar to Immigrants from Eastern Europe are Immigrants from Egypt (62.4%, a difference of 0.010%), Romanian (62.4%, a difference of 0.040%), Immigrants from Croatia (62.3%, a difference of 0.090%), Immigrants from Western Asia (62.5%, a difference of 0.10%), and British (62.3%, a difference of 0.20%).
| Demographics | Rating | Rank | College, 1 year or more |
| Immigrants | England | 98.6 /100 | #84 | Exceptional 62.8% |
| Immigrants | Pakistan | 98.6 /100 | #85 | Exceptional 62.8% |
| Immigrants | Western Europe | 98.6 /100 | #86 | Exceptional 62.7% |
| Immigrants | Hungary | 98.6 /100 | #87 | Exceptional 62.7% |
| Greeks | 98.3 /100 | #88 | Exceptional 62.6% |
| Immigrants | Ethiopia | 98.2 /100 | #89 | Exceptional 62.6% |
| Immigrants | Western Asia | 97.9 /100 | #90 | Exceptional 62.5% |
| Immigrants | Eastern Europe | 97.8 /100 | #91 | Exceptional 62.4% |
| Immigrants | Egypt | 97.8 /100 | #92 | Exceptional 62.4% |
| Romanians | 97.7 /100 | #93 | Exceptional 62.4% |
| Immigrants | Croatia | 97.6 /100 | #94 | Exceptional 62.3% |
| British | 97.4 /100 | #95 | Exceptional 62.3% |
| Chinese | 97.2 /100 | #96 | Exceptional 62.2% |
| Jordanians | 97.2 /100 | #97 | Exceptional 62.2% |
| Carpatho Rusyns | 97.2 /100 | #98 | Exceptional 62.2% |
Demographics Similar to Cree by College, 1 year or more
In terms of college, 1 year or more, the demographic groups most similar to Cree are Immigrants from Fiji (56.9%, a difference of 0.13%), Liberian (56.7%, a difference of 0.22%), Immigrants (57.0%, a difference of 0.28%), Immigrants from Western Africa (57.0%, a difference of 0.35%), and Vietnamese (57.0%, a difference of 0.37%).
| Demographics | Rating | Rank | College, 1 year or more |
| Sub-Saharan Africans | 6.1 /100 | #222 | Tragic 57.3% |
| Portuguese | 5.4 /100 | #223 | Tragic 57.2% |
| Hmong | 5.4 /100 | #224 | Tragic 57.2% |
| Vietnamese | 4.7 /100 | #225 | Tragic 57.0% |
| Immigrants | Western Africa | 4.6 /100 | #226 | Tragic 57.0% |
| Immigrants | Immigrants | 4.4 /100 | #227 | Tragic 57.0% |
| Immigrants | Fiji | 4.0 /100 | #228 | Tragic 56.9% |
| Cree | 3.6 /100 | #229 | Tragic 56.8% |
| Liberians | 3.1 /100 | #230 | Tragic 56.7% |
| Immigrants | Burma/Myanmar | 2.7 /100 | #231 | Tragic 56.6% |
| Immigrants | Bangladesh | 2.6 /100 | #232 | Tragic 56.6% |
| Immigrants | Nonimmigrants | 2.5 /100 | #233 | Tragic 56.5% |
| Spanish Americans | 1.8 /100 | #234 | Tragic 56.3% |
| West Indians | 1.8 /100 | #235 | Tragic 56.3% |
| Iroquois | 1.7 /100 | #236 | Tragic 56.2% |