Immigrants from Eastern Asia vs Comanche 6th Grade

COMPARE

Immigrants from Eastern Asia
Race
Ancestry
AfghanAfricanAlaska NativeAlaskan AthabascanAlbanianAleutAlsatianAmericanApacheArabArapahoArgentineanArmenianAssyrian/Chaldean/SyriacAustralianAustrianBahamianBangladeshiBarbadianBasqueBelgianBelizeanBermudanBhutaneseBlackfeetBolivianBrazilianBritishBritish West IndianBulgarianBurmeseCajunCambodianCanadianCape VerdeanCarpatho RusynCelticCentral AmericanCentral American IndianCherokeeCheyenneChickasawChileanChineseChippewaChoctawColombianColvilleCosta RicanCreeCreekCroatianCrowCubanCypriotCzechCzechoslovakianDanishDelawareDominicanDutchDutch West IndianEastern EuropeanEcuadorianEgyptianEnglishEstonianEthiopianEuropeanFijianFilipinoFinnishFrenchFrench American IndianFrench CanadianGermanGerman RussianGhanaianGreekGuamanian/ChamorroGuatemalanGuyaneseHaitianHmongHonduranHopiHoumaHungarianIcelanderIndian (Asian)IndonesianInupiatIranianIraqiIrishIroquoisIsraeliItalianJamaicanJapaneseJordanianKenyanKiowaKoreanLaotianLatvianLebaneseLiberianLithuanianLumbeeLuxembourgerMacedonianMalaysianMalteseMarshalleseMenomineeMexicanMexican American IndianMongolianMoroccanNative HawaiianNavajoNepaleseNew ZealanderNicaraguanNigerianNorthern EuropeanNorwegianOkinawanOsageOttawaPaiutePakistaniPalestinianPanamanianParaguayanPennsylvania GermanPeruvianPimaPolishPortuguesePotawatomiPuebloPuerto RicanPuget Sound SalishRomanianRussianSalvadoranSamoanScandinavianScotch-IrishScottishSeminoleSenegaleseSerbianShoshoneSierra LeoneanSiouxSlavicSlovakSloveneSomaliSouth AfricanSouth AmericanSouth American IndianSoviet UnionSpaniardSpanishSpanish AmericanSpanish American IndianSri LankanSubsaharan AfricanSudaneseSwedishSwissSyrianTaiwaneseThaiTlingit-HaidaTohono O'OdhamTonganTrinidadian and TobagonianTsimshianTurkishU.S. Virgin IslanderUgandanUkrainianUruguayanUteVenezuelanVietnameseWelshWest IndianYakamaYaquiYugoslavianYumanYup'ikZimbabwean
Immigration
NonimmigrantsImmigrantsAfghanistanAfricaAlbaniaArgentinaArmeniaAsiaAustraliaAustriaBahamasBangladeshBarbadosBelarusBelgiumBelizeBoliviaBosnia and HerzegovinaBrazilBulgariaBurma/MyanmarCabo VerdeCambodiaCameroonCanadaCaribbeanCentral AmericaChileChinaColombiaCongoCosta RicaCroatiaCubaCzechoslovakiaDenmarkDominicaDominican RepublicEastern AfricaEastern AsiaEastern EuropeEcuadorEgyptEl SalvadorEnglandEritreaEthiopiaEuropeFijiFranceGermanyGhanaGreeceGrenadaGuatemalaGuyanaHaitiHondurasHong KongHungaryIndiaIndonesiaIranIraqIrelandIsraelItalyJamaicaJapanJordanKazakhstanKenyaKoreaKuwaitLaosLatin AmericaLatviaLebanonLiberiaLithuaniaMalaysiaMexicoMicronesiaMiddle AfricaMoldovaMoroccoNepalNetherlandsNicaraguaNigeriaNorth AmericaNorth MacedoniaNorthern AfricaNorthern EuropeNorwayOceaniaPakistanPanamaPeruPhilippinesPolandPortugalRomaniaRussiaSaudi ArabiaScotlandSenegalSerbiaSierra LeoneSingaporeSomaliaSouth AfricaSouth AmericaSouth Central AsiaSouth Eastern AsiaSouthern EuropeSpainSri LankaSt. Vincent and the GrenadinesSudanSwedenSwitzerlandSyriaTaiwanThailandTrinidad and TobagoTurkeyUgandaUkraineUruguayUzbekistanVenezuelaVietnamWest IndiesWestern AfricaWestern AsiaWestern EuropeYemenZaireZimbabweAzores
Comanche
Race
Ancestry
AfghanAfricanAlaska NativeAlaskan AthabascanAlbanianAleutAlsatianAmericanApacheArabArapahoArgentineanArmenianAssyrian/Chaldean/SyriacAustralianAustrianBahamianBangladeshiBarbadianBasqueBelgianBelizeanBermudanBhutaneseBlackfeetBolivianBrazilianBritishBritish West IndianBulgarianBurmeseCajunCambodianCanadianCape VerdeanCarpatho RusynCelticCentral AmericanCentral American IndianCherokeeCheyenneChickasawChileanChineseChippewaChoctawColombianColvilleComancheCosta RicanCreeCreekCroatianCrowCubanCypriotCzechCzechoslovakianDanishDelawareDominicanDutchDutch West IndianEastern EuropeanEcuadorianEgyptianEnglishEstonianEthiopianEuropeanFijianFilipinoFinnishFrenchFrench American IndianFrench CanadianGermanGerman RussianGhanaianGreekGuamanian/ChamorroGuatemalanGuyaneseHaitianHmongHonduranHopiHoumaHungarianIcelanderIndian (Asian)IndonesianInupiatIranianIraqiIrishIroquoisIsraeliItalianJamaicanJapaneseJordanianKenyanKiowaKoreanLaotianLatvianLebaneseLiberianLithuanianLumbeeLuxembourgerMacedonianMalaysianMalteseMarshalleseMenomineeMexicanMexican American IndianMongolianMoroccanNative HawaiianNavajoNepaleseNew ZealanderNicaraguanNigerianNorthern EuropeanNorwegianOkinawanOsageOttawaPaiutePakistaniPalestinianPanamanianParaguayanPennsylvania GermanPeruvianPimaPolishPortuguesePotawatomiPuebloPuerto RicanPuget Sound SalishRomanianRussianSalvadoranSamoanScandinavianScotch-IrishScottishSeminoleSenegaleseSerbianShoshoneSierra LeoneanSiouxSlavicSlovakSloveneSomaliSouth AfricanSouth AmericanSouth American IndianSoviet UnionSpaniardSpanishSpanish AmericanSpanish American IndianSri LankanSubsaharan AfricanSudaneseSwedishSwissSyrianTaiwaneseThaiTlingit-HaidaTohono O'OdhamTonganTrinidadian and TobagonianTsimshianTurkishU.S. Virgin IslanderUgandanUkrainianUruguayanUteVenezuelanVietnameseWelshWest IndianYakamaYaquiYugoslavianYumanYup'ikZimbabwean
Immigration
NonimmigrantsImmigrantsAfghanistanAfricaAlbaniaArgentinaArmeniaAsiaAustraliaAustriaBahamasBangladeshBarbadosBelarusBelgiumBelizeBoliviaBosnia and HerzegovinaBrazilBulgariaBurma/MyanmarCabo VerdeCambodiaCameroonCanadaCaribbeanCentral AmericaChileChinaColombiaCongoCosta RicaCroatiaCubaCzechoslovakiaDenmarkDominicaDominican RepublicEastern AfricaEastern EuropeEcuadorEgyptEl SalvadorEnglandEritreaEthiopiaEuropeFijiFranceGermanyGhanaGreeceGrenadaGuatemalaGuyanaHaitiHondurasHong KongHungaryIndiaIndonesiaIranIraqIrelandIsraelItalyJamaicaJapanJordanKazakhstanKenyaKoreaKuwaitLaosLatin AmericaLatviaLebanonLiberiaLithuaniaMalaysiaMexicoMicronesiaMiddle AfricaMoldovaMoroccoNepalNetherlandsNicaraguaNigeriaNorth AmericaNorth MacedoniaNorthern AfricaNorthern EuropeNorwayOceaniaPakistanPanamaPeruPhilippinesPolandPortugalRomaniaRussiaSaudi ArabiaScotlandSenegalSerbiaSierra LeoneSingaporeSomaliaSouth AfricaSouth AmericaSouth Central AsiaSouth Eastern AsiaSouthern EuropeSpainSri LankaSt. Vincent and the GrenadinesSudanSwedenSwitzerlandSyriaTaiwanThailandTrinidad and TobagoTurkeyUgandaUkraineUruguayUzbekistanVenezuelaVietnamWest IndiesWestern AfricaWestern AsiaWestern EuropeYemenZaireZimbabweAzores
6th Grade
Income
Poverty
Unemployment
Labor Participation
Family Structure
Vehicle Availability
Education Level
Disability

6th Grade Comparison

Immigrants from Eastern Asia

Comanche

Tragic
Fair
96.7%
6TH GRADE
4.0/ 100
METRIC RATING
230th/ 347
METRIC RANK
97.0%
6TH GRADE
37.9/ 100
METRIC RATING
181st/ 347
METRIC RANK

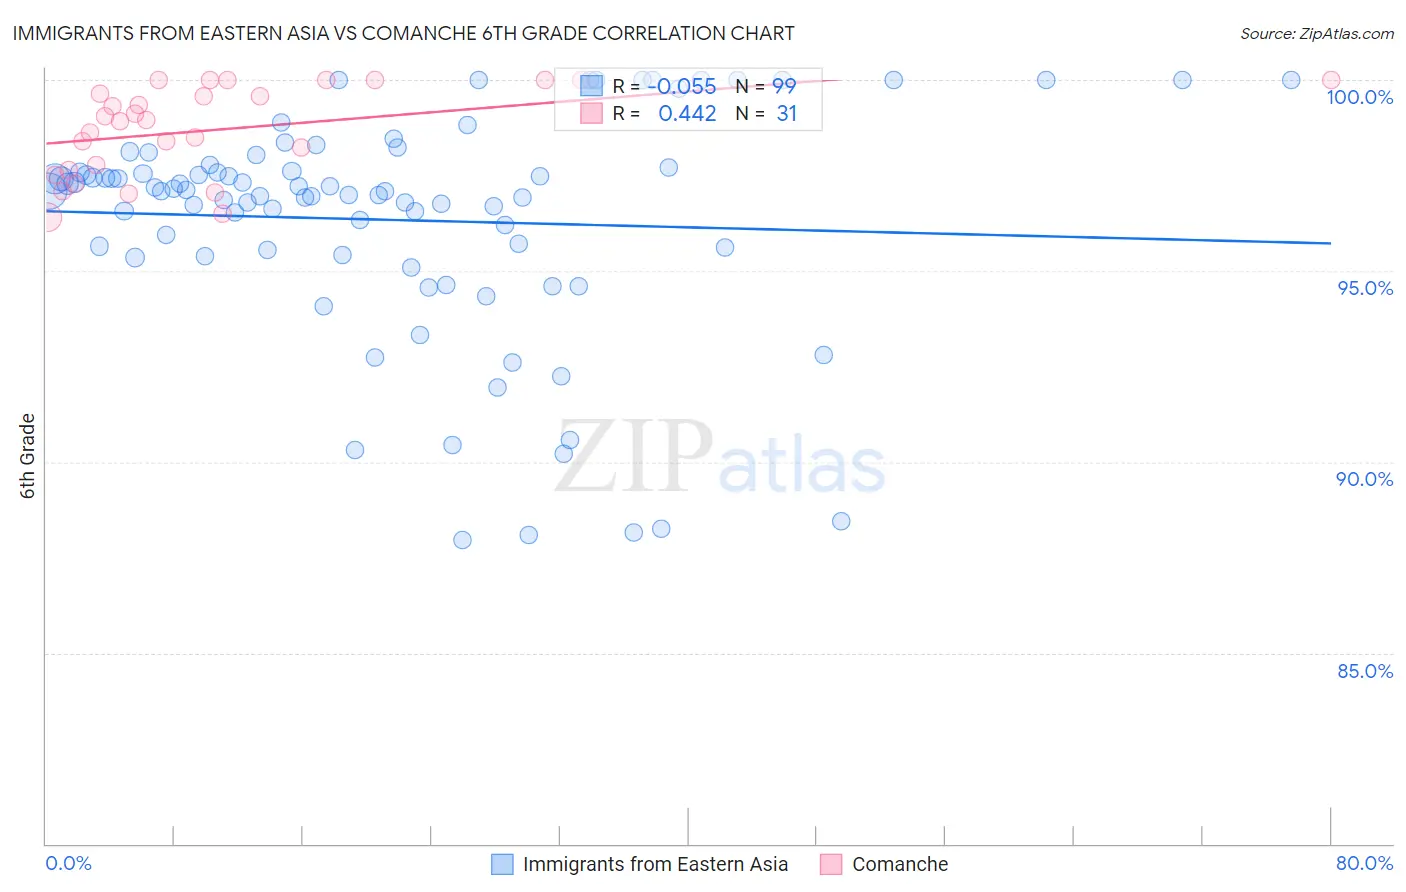
Immigrants from Eastern Asia vs Comanche 6th Grade Correlation Chart

The statistical analysis conducted on geographies consisting of 499,865,893 people shows a slight negative correlation between the proportion of Immigrants from Eastern Asia and percentage of population with at least 6th grade education in the United States with a correlation coefficient (R) of -0.055 and weighted average of 96.7%. Similarly, the statistical analysis conducted on geographies consisting of 109,786,530 people shows a moderate positive correlation between the proportion of Comanche and percentage of population with at least 6th grade education in the United States with a correlation coefficient (R) of 0.442 and weighted average of 97.0%, a difference of 0.31%.
Immigrants from Eastern Asia vs Comanche 6th Grade

6th Grade Correlation Summary

MeasurementImmigrants from Eastern AsiaComanche
Minimum88.0%96.4%
Maximum100.0%100.0%
Range12.0%3.6%
Mean96.3%98.7%
Median97.1%99.0%
Interquartile 25% (IQ1)95.4%97.6%
Interquartile 75% (IQ3)97.7%100.0%
Interquartile Range (IQR)2.3%2.4%
Standard Deviation (Sample)2.9%1.2%
Standard Deviation (Population)2.9%1.2%

Similar Demographics by 6th Grade

Demographics Similar to Immigrants from Eastern Asia by 6th Grade

In terms of 6th grade, the demographic groups most similar to Immigrants from Eastern Asia are Immigrants from Western Asia (96.7%, a difference of 0.0%), Immigrants from Malaysia (96.7%, a difference of 0.0%), Assyrian/Chaldean/Syriac (96.7%, a difference of 0.0%), Immigrants from Southern Europe (96.7%, a difference of 0.010%), and Immigrants from Pakistan (96.7%, a difference of 0.010%).
DemographicsRating | Rank6th Grade
Bahamians
4.8
/100
|
#223
Tragic
96.7%
Immigrants | Southern Europe
4.4
/100
|
#224
Tragic
96.7%
Immigrants | Pakistan
4.4
/100
|
#225
Tragic
96.7%
Immigrants | Panama
4.2
/100
|
#226
Tragic
96.7%
Immigrants | Western Asia
4.1
/100
|
#227
Tragic
96.7%
Immigrants | Malaysia
4.0
/100
|
#228
Tragic
96.7%
Assyrians/Chaldeans/Syriacs
4.0
/100
|
#229
Tragic
96.7%
Immigrants | Eastern Asia
4.0
/100
|
#230
Tragic
96.7%
Sub-Saharan Africans
3.5
/100
|
#231
Tragic
96.7%
South American Indians
3.5
/100
|
#232
Tragic
96.7%
Yuman
3.2
/100
|
#233
Tragic
96.7%
Uruguayans
2.5
/100
|
#234
Tragic
96.6%
Asians
2.4
/100
|
#235
Tragic
96.6%
Immigrants | Indonesia
2.3
/100
|
#236
Tragic
96.6%
Immigrants | Eastern Africa
2.0
/100
|
#237
Tragic
96.6%

Demographics Similar to Comanche by 6th Grade

In terms of 6th grade, the demographic groups most similar to Comanche are Immigrants from Spain (97.0%, a difference of 0.010%), Immigrants from Ukraine (97.0%, a difference of 0.010%), Immigrants from Venezuela (97.0%, a difference of 0.020%), Spanish American (97.0%, a difference of 0.020%), and Argentinean (97.0%, a difference of 0.020%).
DemographicsRating | Rank6th Grade
Venezuelans
50.0
/100
|
#174
Average
97.0%
Immigrants | Kazakhstan
47.3
/100
|
#175
Average
97.0%
Immigrants | Micronesia
47.1
/100
|
#176
Average
97.0%
Mongolians
46.7
/100
|
#177
Average
97.0%
Pakistanis
46.0
/100
|
#178
Average
97.0%
Immigrants | Kenya
45.3
/100
|
#179
Average
97.0%
Immigrants | Spain
39.9
/100
|
#180
Fair
97.0%
Comanche
37.9
/100
|
#181
Fair
97.0%
Immigrants | Ukraine
35.6
/100
|
#182
Fair
97.0%
Immigrants | Venezuela
34.5
/100
|
#183
Fair
97.0%
Spanish Americans
33.5
/100
|
#184
Fair
97.0%
Argentineans
33.0
/100
|
#185
Fair
97.0%
Immigrants | Egypt
31.4
/100
|
#186
Fair
97.0%
Guamanians/Chamorros
30.6
/100
|
#187
Fair
97.0%
Immigrants | Argentina
30.4
/100
|
#188
Fair
97.0%