Immigrants from Dominica vs Irish 10th Grade
COMPARE
Immigrants from Dominica
Irish
10th Grade
10th Grade Comparison
Immigrants from Dominica
Irish
91.1%
10TH GRADE
0.0/ 100
METRIC RATING
305th/ 347
METRIC RANK
95.6%
10TH GRADE
100.0/ 100
METRIC RATING
15th/ 347
METRIC RANK
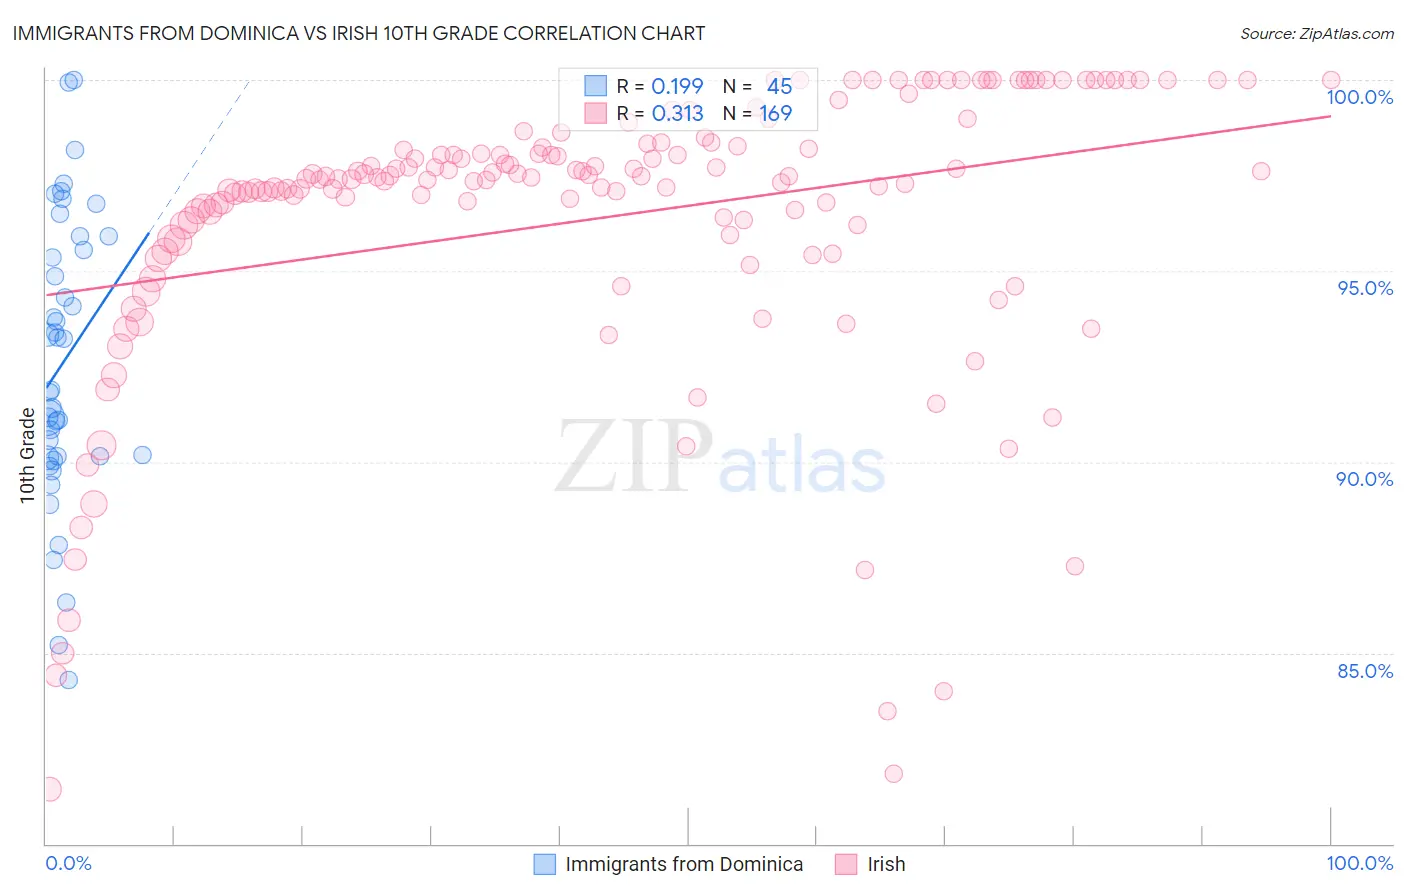
Immigrants from Dominica vs Irish 10th Grade Correlation Chart
The statistical analysis conducted on geographies consisting of 83,794,115 people shows a poor positive correlation between the proportion of Immigrants from Dominica and percentage of population with at least 10th grade education in the United States with a correlation coefficient (R) of 0.199 and weighted average of 91.1%. Similarly, the statistical analysis conducted on geographies consisting of 580,709,891 people shows a mild positive correlation between the proportion of Irish and percentage of population with at least 10th grade education in the United States with a correlation coefficient (R) of 0.313 and weighted average of 95.6%, a difference of 4.9%.
10th Grade Correlation Summary
| Measurement | Immigrants from Dominica | Irish |
| Minimum | 84.3% | 81.4% |
| Maximum | 100.0% | 100.0% |
| Range | 15.7% | 18.6% |
| Mean | 92.6% | 96.4% |
| Median | 91.9% | 97.4% |
| Interquartile 25% (IQ1) | 90.1% | 95.9% |
| Interquartile 75% (IQ3) | 95.7% | 98.3% |
| Interquartile Range (IQR) | 5.6% | 2.4% |
| Standard Deviation (Sample) | 3.7% | 3.8% |
| Standard Deviation (Population) | 3.7% | 3.8% |
Similar Demographics by 10th Grade
Demographics Similar to Immigrants from Dominica by 10th Grade
In terms of 10th grade, the demographic groups most similar to Immigrants from Dominica are Pima (91.2%, a difference of 0.020%), Yaqui (91.1%, a difference of 0.060%), Immigrants from Vietnam (91.2%, a difference of 0.070%), Immigrants from Guyana (91.2%, a difference of 0.090%), and Japanese (91.2%, a difference of 0.10%).
| Demographics | Rating | Rank | 10th Grade |
| Cubans | 0.0 /100 | #298 | Tragic 91.5% |
| Immigrants | Haiti | 0.0 /100 | #299 | Tragic 91.4% |
| Guyanese | 0.0 /100 | #300 | Tragic 91.4% |
| Japanese | 0.0 /100 | #301 | Tragic 91.2% |
| Immigrants | Guyana | 0.0 /100 | #302 | Tragic 91.2% |
| Immigrants | Vietnam | 0.0 /100 | #303 | Tragic 91.2% |
| Pima | 0.0 /100 | #304 | Tragic 91.2% |
| Immigrants | Dominica | 0.0 /100 | #305 | Tragic 91.1% |
| Yaqui | 0.0 /100 | #306 | Tragic 91.1% |
| Immigrants | Fiji | 0.0 /100 | #307 | Tragic 91.0% |
| Immigrants | Bangladesh | 0.0 /100 | #308 | Tragic 91.0% |
| Immigrants | Immigrants | 0.0 /100 | #309 | Tragic 91.0% |
| Vietnamese | 0.0 /100 | #310 | Tragic 90.9% |
| Immigrants | Cambodia | 0.0 /100 | #311 | Tragic 90.9% |
| Immigrants | Portugal | 0.0 /100 | #312 | Tragic 90.8% |
Demographics Similar to Irish by 10th Grade
In terms of 10th grade, the demographic groups most similar to Irish are Scottish (95.6%, a difference of 0.010%), Tsimshian (95.6%, a difference of 0.020%), Latvian (95.6%, a difference of 0.020%), English (95.6%, a difference of 0.030%), and Italian (95.6%, a difference of 0.030%).
| Demographics | Rating | Rank | 10th Grade |
| Lithuanians | 100.0 /100 | #8 | Exceptional 95.8% |
| Finns | 100.0 /100 | #9 | Exceptional 95.8% |
| Croatians | 100.0 /100 | #10 | Exceptional 95.7% |
| Danes | 100.0 /100 | #11 | Exceptional 95.7% |
| Tlingit-Haida | 100.0 /100 | #12 | Exceptional 95.7% |
| English | 100.0 /100 | #13 | Exceptional 95.6% |
| Tsimshian | 100.0 /100 | #14 | Exceptional 95.6% |
| Irish | 100.0 /100 | #15 | Exceptional 95.6% |
| Scottish | 100.0 /100 | #16 | Exceptional 95.6% |
| Latvians | 100.0 /100 | #17 | Exceptional 95.6% |
| Italians | 100.0 /100 | #18 | Exceptional 95.6% |
| Scandinavians | 100.0 /100 | #19 | Exceptional 95.6% |
| Chinese | 100.0 /100 | #20 | Exceptional 95.5% |
| Dutch | 100.0 /100 | #21 | Exceptional 95.5% |
| Eastern Europeans | 100.0 /100 | #22 | Exceptional 95.5% |