Immigrants from Czechoslovakia vs Immigrants from Eritrea GED/Equivalency

COMPARE

Immigrants from Czechoslovakia
Race
Ancestry
AfghanAfricanAlaska NativeAlaskan AthabascanAlbanianAleutAlsatianAmericanApacheArabArapahoArgentineanArmenianAssyrian/Chaldean/SyriacAustralianAustrianBahamianBangladeshiBarbadianBasqueBelgianBelizeanBermudanBhutaneseBlackfeetBolivianBrazilianBritishBritish West IndianBulgarianBurmeseCajunCambodianCanadianCape VerdeanCarpatho RusynCelticCentral AmericanCentral American IndianCherokeeCheyenneChickasawChileanChineseChippewaChoctawColombianColvilleComancheCosta RicanCreeCreekCroatianCrowCubanCypriotCzechCzechoslovakianDanishDelawareDominicanDutchDutch West IndianEastern EuropeanEcuadorianEgyptianEnglishEstonianEthiopianEuropeanFijianFilipinoFinnishFrenchFrench American IndianFrench CanadianGermanGerman RussianGhanaianGreekGuamanian/ChamorroGuatemalanGuyaneseHaitianHmongHonduranHopiHoumaHungarianIcelanderIndian (Asian)IndonesianInupiatIranianIraqiIrishIroquoisIsraeliItalianJamaicanJapaneseJordanianKenyanKiowaKoreanLaotianLatvianLebaneseLiberianLithuanianLumbeeLuxembourgerMacedonianMalaysianMalteseMarshalleseMenomineeMexicanMexican American IndianMongolianMoroccanNative HawaiianNavajoNepaleseNew ZealanderNicaraguanNigerianNorthern EuropeanNorwegianOkinawanOsageOttawaPaiutePakistaniPalestinianPanamanianParaguayanPennsylvania GermanPeruvianPimaPolishPortuguesePotawatomiPuebloPuerto RicanPuget Sound SalishRomanianRussianSalvadoranSamoanScandinavianScotch-IrishScottishSeminoleSenegaleseSerbianShoshoneSierra LeoneanSiouxSlavicSlovakSloveneSomaliSouth AfricanSouth AmericanSouth American IndianSoviet UnionSpaniardSpanishSpanish AmericanSpanish American IndianSri LankanSubsaharan AfricanSudaneseSwedishSwissSyrianTaiwaneseThaiTlingit-HaidaTohono O'OdhamTonganTrinidadian and TobagonianTsimshianTurkishU.S. Virgin IslanderUgandanUkrainianUruguayanUteVenezuelanVietnameseWelshWest IndianYakamaYaquiYugoslavianYumanYup'ikZimbabwean
Immigration
NonimmigrantsImmigrantsAfghanistanAfricaAlbaniaArgentinaArmeniaAsiaAustraliaAustriaBahamasBangladeshBarbadosBelarusBelgiumBelizeBoliviaBosnia and HerzegovinaBrazilBulgariaBurma/MyanmarCabo VerdeCambodiaCameroonCanadaCaribbeanCentral AmericaChileChinaColombiaCongoCosta RicaCroatiaCubaCzechoslovakiaDenmarkDominicaDominican RepublicEastern AfricaEastern AsiaEastern EuropeEcuadorEgyptEl SalvadorEnglandEthiopiaEuropeFijiFranceGermanyGhanaGreeceGrenadaGuatemalaGuyanaHaitiHondurasHong KongHungaryIndiaIndonesiaIranIraqIrelandIsraelItalyJamaicaJapanJordanKazakhstanKenyaKoreaKuwaitLaosLatin AmericaLatviaLebanonLiberiaLithuaniaMalaysiaMexicoMicronesiaMiddle AfricaMoldovaMoroccoNepalNetherlandsNicaraguaNigeriaNorth AmericaNorth MacedoniaNorthern AfricaNorthern EuropeNorwayOceaniaPakistanPanamaPeruPhilippinesPolandPortugalRomaniaRussiaSaudi ArabiaScotlandSenegalSerbiaSierra LeoneSingaporeSomaliaSouth AfricaSouth AmericaSouth Central AsiaSouth Eastern AsiaSouthern EuropeSpainSri LankaSt. Vincent and the GrenadinesSudanSwedenSwitzerlandSyriaTaiwanThailandTrinidad and TobagoTurkeyUgandaUkraineUruguayUzbekistanVenezuelaVietnamWest IndiesWestern AfricaWestern AsiaWestern EuropeYemenZaireZimbabweAzores
Immigrants from Eritrea
Race
Ancestry
AfghanAfricanAlaska NativeAlaskan AthabascanAlbanianAleutAlsatianAmericanApacheArabArapahoArgentineanArmenianAssyrian/Chaldean/SyriacAustralianAustrianBahamianBangladeshiBarbadianBasqueBelgianBelizeanBermudanBhutaneseBlackfeetBolivianBrazilianBritishBritish West IndianBulgarianBurmeseCajunCambodianCanadianCape VerdeanCarpatho RusynCelticCentral AmericanCentral American IndianCherokeeCheyenneChickasawChileanChineseChippewaChoctawColombianColvilleComancheCosta RicanCreeCreekCroatianCrowCubanCypriotCzechCzechoslovakianDanishDelawareDominicanDutchDutch West IndianEastern EuropeanEcuadorianEgyptianEnglishEstonianEthiopianEuropeanFijianFilipinoFinnishFrenchFrench American IndianFrench CanadianGermanGerman RussianGhanaianGreekGuamanian/ChamorroGuatemalanGuyaneseHaitianHmongHonduranHopiHoumaHungarianIcelanderIndian (Asian)IndonesianInupiatIranianIraqiIrishIroquoisIsraeliItalianJamaicanJapaneseJordanianKenyanKiowaKoreanLaotianLatvianLebaneseLiberianLithuanianLumbeeLuxembourgerMacedonianMalaysianMalteseMarshalleseMenomineeMexicanMexican American IndianMongolianMoroccanNative HawaiianNavajoNepaleseNew ZealanderNicaraguanNigerianNorthern EuropeanNorwegianOkinawanOsageOttawaPaiutePakistaniPalestinianPanamanianParaguayanPennsylvania GermanPeruvianPimaPolishPortuguesePotawatomiPuebloPuerto RicanPuget Sound SalishRomanianRussianSalvadoranSamoanScandinavianScotch-IrishScottishSeminoleSenegaleseSerbianShoshoneSierra LeoneanSiouxSlavicSlovakSloveneSomaliSouth AfricanSouth AmericanSouth American IndianSoviet UnionSpaniardSpanishSpanish AmericanSpanish American IndianSri LankanSubsaharan AfricanSudaneseSwedishSwissSyrianTaiwaneseThaiTlingit-HaidaTohono O'OdhamTonganTrinidadian and TobagonianTsimshianTurkishU.S. Virgin IslanderUgandanUkrainianUruguayanUteVenezuelanVietnameseWelshWest IndianYakamaYaquiYugoslavianYumanYup'ikZimbabwean
Immigration
NonimmigrantsImmigrantsAfghanistanAfricaAlbaniaArgentinaArmeniaAsiaAustraliaAustriaBahamasBangladeshBarbadosBelarusBelgiumBelizeBoliviaBosnia and HerzegovinaBrazilBulgariaBurma/MyanmarCabo VerdeCambodiaCameroonCanadaCaribbeanCentral AmericaChileChinaColombiaCongoCosta RicaCroatiaCubaDenmarkDominicaDominican RepublicEastern AfricaEastern AsiaEastern EuropeEcuadorEgyptEl SalvadorEnglandEritreaEthiopiaEuropeFijiFranceGermanyGhanaGreeceGrenadaGuatemalaGuyanaHaitiHondurasHong KongHungaryIndiaIndonesiaIranIraqIrelandIsraelItalyJamaicaJapanJordanKazakhstanKenyaKoreaKuwaitLaosLatin AmericaLatviaLebanonLiberiaLithuaniaMalaysiaMexicoMicronesiaMiddle AfricaMoldovaMoroccoNepalNetherlandsNicaraguaNigeriaNorth AmericaNorth MacedoniaNorthern AfricaNorthern EuropeNorwayOceaniaPakistanPanamaPeruPhilippinesPolandPortugalRomaniaRussiaSaudi ArabiaScotlandSenegalSerbiaSierra LeoneSingaporeSomaliaSouth AfricaSouth AmericaSouth Central AsiaSouth Eastern AsiaSouthern EuropeSpainSri LankaSt. Vincent and the GrenadinesSudanSwedenSwitzerlandSyriaTaiwanThailandTrinidad and TobagoTurkeyUgandaUkraineUruguayUzbekistanVenezuelaVietnamWest IndiesWestern AfricaWestern AsiaWestern EuropeYemenZaireZimbabweAzores
GED/Equivalency
Income
Poverty
Unemployment
Labor Participation
Family Structure
Vehicle Availability
Education Level
Disability

GED/Equivalency Comparison

Immigrants from Czechoslovakia

Immigrants from Eritrea

Exceptional
Tragic
87.9%
GED/EQUIVALENCY
99.3/ 100
METRIC RATING
57th/ 347
METRIC RANK
84.3%
GED/EQUIVALENCY
3.5/ 100
METRIC RATING
236th/ 347
METRIC RANK

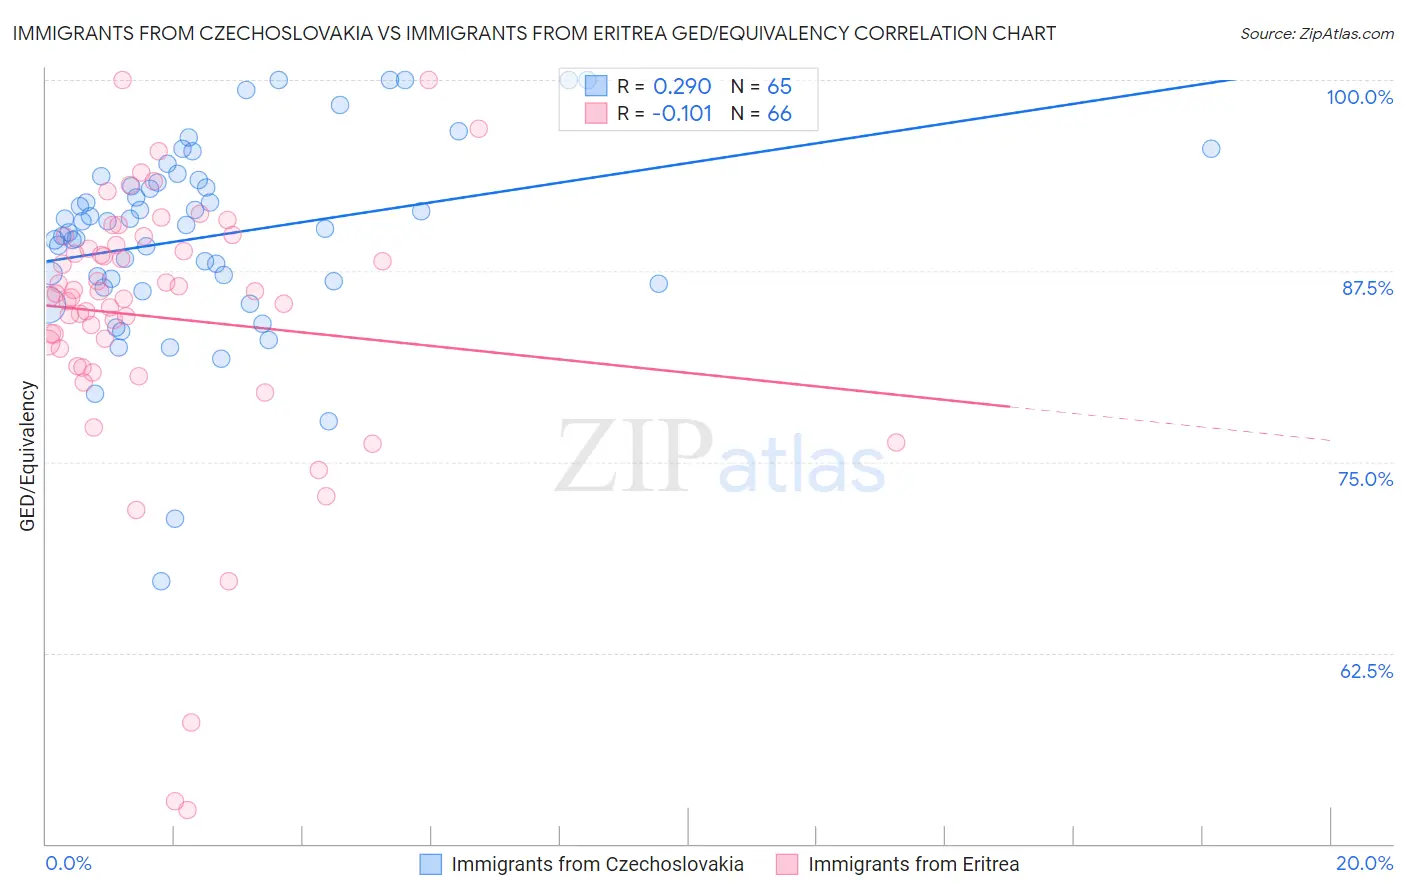
Immigrants from Czechoslovakia vs Immigrants from Eritrea GED/Equivalency Correlation Chart

The statistical analysis conducted on geographies consisting of 195,448,106 people shows a weak positive correlation between the proportion of Immigrants from Czechoslovakia and percentage of population with at least ged/equivalency education in the United States with a correlation coefficient (R) of 0.290 and weighted average of 87.9%. Similarly, the statistical analysis conducted on geographies consisting of 104,852,788 people shows a poor negative correlation between the proportion of Immigrants from Eritrea and percentage of population with at least ged/equivalency education in the United States with a correlation coefficient (R) of -0.101 and weighted average of 84.3%, a difference of 4.3%.
Immigrants from Czechoslovakia vs Immigrants from Eritrea GED/Equivalency

GED/Equivalency Correlation Summary

MeasurementImmigrants from CzechoslovakiaImmigrants from Eritrea
Minimum67.2%52.2%
Maximum100.0%100.0%
Range32.8%47.8%
Mean89.8%84.5%
Median90.5%85.9%
Interquartile 25% (IQ1)86.7%82.4%
Interquartile 75% (IQ3)93.4%89.2%
Interquartile Range (IQR)6.6%6.8%
Standard Deviation (Sample)6.3%9.0%
Standard Deviation (Population)6.3%8.9%

Similar Demographics by GED/Equivalency

Demographics Similar to Immigrants from Czechoslovakia by GED/Equivalency

In terms of ged/equivalency, the demographic groups most similar to Immigrants from Czechoslovakia are Northern European (87.9%, a difference of 0.0%), Serbian (87.9%, a difference of 0.010%), Scandinavian (87.9%, a difference of 0.020%), European (87.9%, a difference of 0.020%), and German (87.9%, a difference of 0.040%).
DemographicsRating | RankGED/Equivalency
Immigrants | Korea
99.5
/100
|
#50
Exceptional
88.1%
Immigrants | Netherlands
99.4
/100
|
#51
Exceptional
88.0%
Zimbabweans
99.4
/100
|
#52
Exceptional
88.0%
Immigrants | South Africa
99.4
/100
|
#53
Exceptional
88.0%
Soviet Union
99.4
/100
|
#54
Exceptional
88.0%
New Zealanders
99.4
/100
|
#55
Exceptional
88.0%
Immigrants | Denmark
99.4
/100
|
#56
Exceptional
88.0%
Immigrants | Czechoslovakia
99.3
/100
|
#57
Exceptional
87.9%
Northern Europeans
99.3
/100
|
#58
Exceptional
87.9%
Serbians
99.3
/100
|
#59
Exceptional
87.9%
Scandinavians
99.3
/100
|
#60
Exceptional
87.9%
Europeans
99.3
/100
|
#61
Exceptional
87.9%
Germans
99.3
/100
|
#62
Exceptional
87.9%
Immigrants | Turkey
99.2
/100
|
#63
Exceptional
87.9%
Immigrants | Canada
99.2
/100
|
#64
Exceptional
87.9%

Demographics Similar to Immigrants from Eritrea by GED/Equivalency

In terms of ged/equivalency, the demographic groups most similar to Immigrants from Eritrea are Ghanaian (84.3%, a difference of 0.0%), Immigrants from Nigeria (84.3%, a difference of 0.020%), Subsaharan African (84.2%, a difference of 0.070%), Immigrants from South America (84.4%, a difference of 0.10%), and Immigrants from Panama (84.4%, a difference of 0.10%).
DemographicsRating | RankGED/Equivalency
Immigrants | Uruguay
4.6
/100
|
#229
Tragic
84.4%
Immigrants | Colombia
4.5
/100
|
#230
Tragic
84.4%
Immigrants | Middle Africa
4.3
/100
|
#231
Tragic
84.4%
Immigrants | South America
4.2
/100
|
#232
Tragic
84.4%
Immigrants | Panama
4.1
/100
|
#233
Tragic
84.4%
Immigrants | Nigeria
3.6
/100
|
#234
Tragic
84.3%
Ghanaians
3.5
/100
|
#235
Tragic
84.3%
Immigrants | Eritrea
3.5
/100
|
#236
Tragic
84.3%
Sub-Saharan Africans
3.0
/100
|
#237
Tragic
84.2%
Immigrants | Peru
2.7
/100
|
#238
Tragic
84.2%
Immigrants | Bahamas
2.6
/100
|
#239
Tragic
84.2%
Immigrants | South Eastern Asia
2.5
/100
|
#240
Tragic
84.1%
Senegalese
1.9
/100
|
#241
Tragic
84.0%
Sri Lankans
1.9
/100
|
#242
Tragic
84.0%
Cherokee
1.3
/100
|
#243
Tragic
83.9%