Immigrants from Caribbean vs Immigrants from Ethiopia 8th Grade
COMPARE
Immigrants from Caribbean
Immigrants from Ethiopia
8th Grade
8th Grade Comparison
Immigrants from Caribbean
Immigrants from Ethiopia
93.5%
8TH GRADE
0.0/ 100
METRIC RATING
313th/ 347
METRIC RANK
95.0%
8TH GRADE
1.0/ 100
METRIC RATING
252nd/ 347
METRIC RANK
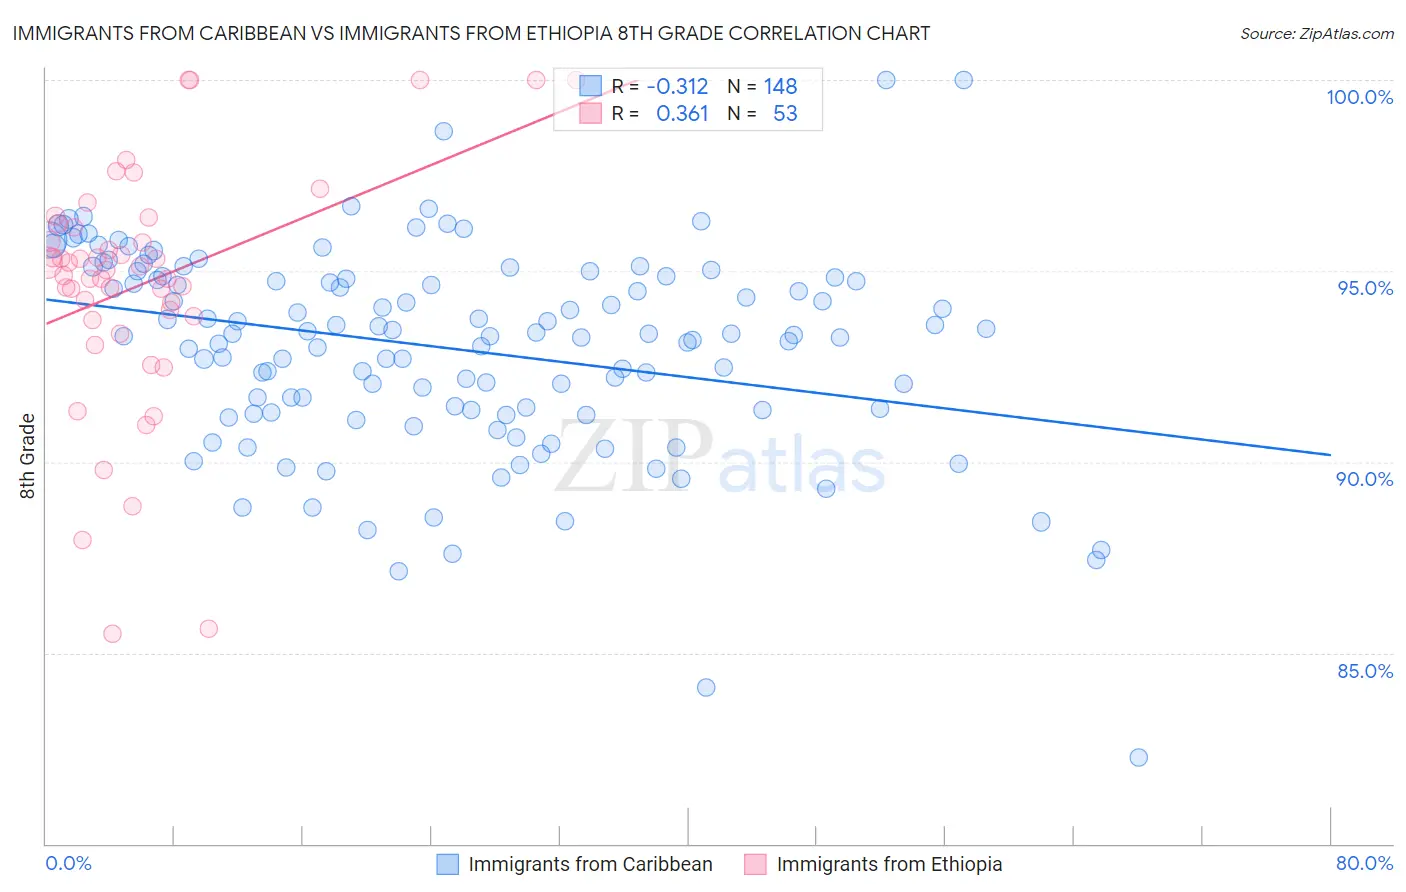
Immigrants from Caribbean vs Immigrants from Ethiopia 8th Grade Correlation Chart
The statistical analysis conducted on geographies consisting of 450,064,731 people shows a mild negative correlation between the proportion of Immigrants from Caribbean and percentage of population with at least 8th grade education in the United States with a correlation coefficient (R) of -0.312 and weighted average of 93.5%. Similarly, the statistical analysis conducted on geographies consisting of 211,528,629 people shows a mild positive correlation between the proportion of Immigrants from Ethiopia and percentage of population with at least 8th grade education in the United States with a correlation coefficient (R) of 0.361 and weighted average of 95.0%, a difference of 1.6%.
8th Grade Correlation Summary
| Measurement | Immigrants from Caribbean | Immigrants from Ethiopia |
| Minimum | 82.3% | 85.5% |
| Maximum | 100.0% | 100.0% |
| Range | 17.7% | 14.5% |
| Mean | 93.0% | 94.7% |
| Median | 93.3% | 95.0% |
| Interquartile 25% (IQ1) | 91.4% | 93.8% |
| Interquartile 75% (IQ3) | 94.8% | 96.2% |
| Interquartile Range (IQR) | 3.5% | 2.4% |
| Standard Deviation (Sample) | 2.7% | 3.2% |
| Standard Deviation (Population) | 2.7% | 3.1% |
Similar Demographics by 8th Grade
Demographics Similar to Immigrants from Caribbean by 8th Grade
In terms of 8th grade, the demographic groups most similar to Immigrants from Caribbean are Immigrants from Vietnam (93.5%, a difference of 0.010%), Vietnamese (93.5%, a difference of 0.020%), Cape Verdean (93.5%, a difference of 0.030%), Immigrants (93.6%, a difference of 0.070%), and Japanese (93.6%, a difference of 0.070%).
| Demographics | Rating | Rank | 8th Grade |
| Immigrants | Guyana | 0.0 /100 | #306 | Tragic 93.8% |
| Immigrants | Portugal | 0.0 /100 | #307 | Tragic 93.8% |
| Ecuadorians | 0.0 /100 | #308 | Tragic 93.6% |
| Immigrants | Immigrants | 0.0 /100 | #309 | Tragic 93.6% |
| Japanese | 0.0 /100 | #310 | Tragic 93.6% |
| Immigrants | Bangladesh | 0.0 /100 | #311 | Tragic 93.6% |
| Cape Verdeans | 0.0 /100 | #312 | Tragic 93.5% |
| Immigrants | Caribbean | 0.0 /100 | #313 | Tragic 93.5% |
| Immigrants | Vietnam | 0.0 /100 | #314 | Tragic 93.5% |
| Vietnamese | 0.0 /100 | #315 | Tragic 93.5% |
| Immigrants | Cambodia | 0.0 /100 | #316 | Tragic 93.3% |
| Immigrants | Ecuador | 0.0 /100 | #317 | Tragic 93.3% |
| Puerto Ricans | 0.0 /100 | #318 | Tragic 93.2% |
| Immigrants | Cuba | 0.0 /100 | #319 | Tragic 93.2% |
| Immigrants | Fiji | 0.0 /100 | #320 | Tragic 93.2% |
Demographics Similar to Immigrants from Ethiopia by 8th Grade
In terms of 8th grade, the demographic groups most similar to Immigrants from Ethiopia are Bolivian (95.0%, a difference of 0.0%), Korean (95.0%, a difference of 0.010%), U.S. Virgin Islander (95.0%, a difference of 0.010%), Immigrants from China (95.0%, a difference of 0.020%), and Immigrants from Cameroon (95.0%, a difference of 0.030%).
| Demographics | Rating | Rank | 8th Grade |
| Jamaicans | 1.4 /100 | #245 | Tragic 95.1% |
| Somalis | 1.4 /100 | #246 | Tragic 95.1% |
| Immigrants | Senegal | 1.4 /100 | #247 | Tragic 95.1% |
| Uruguayans | 1.2 /100 | #248 | Tragic 95.1% |
| Immigrants | China | 1.1 /100 | #249 | Tragic 95.0% |
| Koreans | 1.1 /100 | #250 | Tragic 95.0% |
| Bolivians | 1.0 /100 | #251 | Tragic 95.0% |
| Immigrants | Ethiopia | 1.0 /100 | #252 | Tragic 95.0% |
| U.S. Virgin Islanders | 0.9 /100 | #253 | Tragic 95.0% |
| Immigrants | Cameroon | 0.8 /100 | #254 | Tragic 95.0% |
| Immigrants | Somalia | 0.7 /100 | #255 | Tragic 95.0% |
| Colombians | 0.7 /100 | #256 | Tragic 95.0% |
| Afghans | 0.6 /100 | #257 | Tragic 94.9% |
| Immigrants | Congo | 0.6 /100 | #258 | Tragic 94.9% |
| Ghanaians | 0.6 /100 | #259 | Tragic 94.9% |