Immigrants from Caribbean vs Immigrants from Armenia 8th Grade
COMPARE
Immigrants from Caribbean
Immigrants from Armenia
8th Grade
8th Grade Comparison
Immigrants from Caribbean
Immigrants from Armenia
93.5%
8TH GRADE
0.0/ 100
METRIC RATING
313th/ 347
METRIC RANK
92.3%
8TH GRADE
0.0/ 100
METRIC RATING
330th/ 347
METRIC RANK
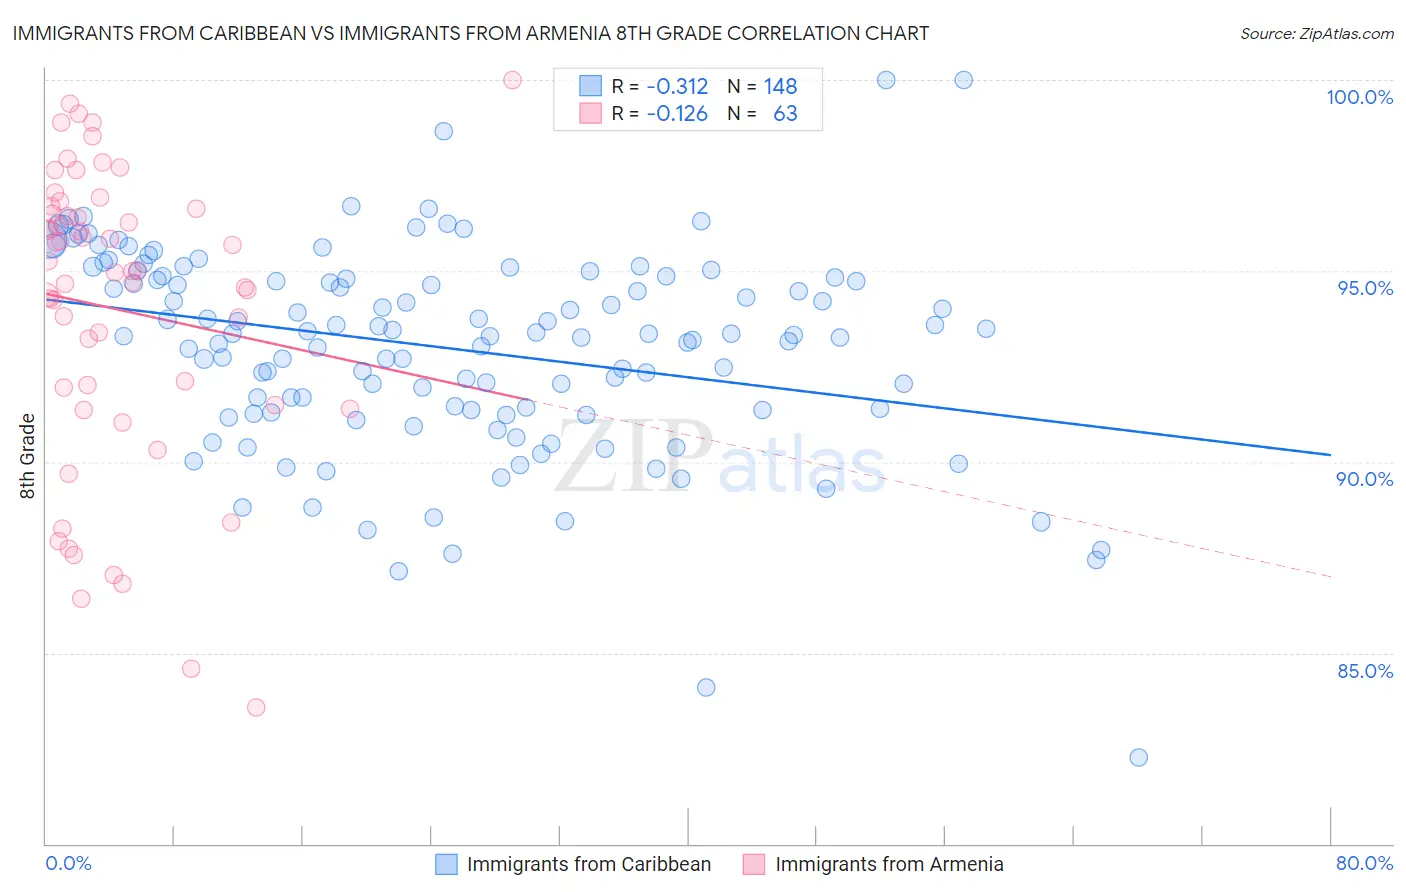
Immigrants from Caribbean vs Immigrants from Armenia 8th Grade Correlation Chart
The statistical analysis conducted on geographies consisting of 450,064,731 people shows a mild negative correlation between the proportion of Immigrants from Caribbean and percentage of population with at least 8th grade education in the United States with a correlation coefficient (R) of -0.312 and weighted average of 93.5%. Similarly, the statistical analysis conducted on geographies consisting of 97,657,339 people shows a poor negative correlation between the proportion of Immigrants from Armenia and percentage of population with at least 8th grade education in the United States with a correlation coefficient (R) of -0.126 and weighted average of 92.3%, a difference of 1.3%.
8th Grade Correlation Summary
| Measurement | Immigrants from Caribbean | Immigrants from Armenia |
| Minimum | 82.3% | 83.6% |
| Maximum | 100.0% | 100.0% |
| Range | 17.7% | 16.4% |
| Mean | 93.0% | 94.0% |
| Median | 93.3% | 95.0% |
| Interquartile 25% (IQ1) | 91.4% | 91.5% |
| Interquartile 75% (IQ3) | 94.8% | 96.6% |
| Interquartile Range (IQR) | 3.5% | 5.1% |
| Standard Deviation (Sample) | 2.7% | 3.9% |
| Standard Deviation (Population) | 2.7% | 3.9% |
Demographics Similar to Immigrants from Caribbean and Immigrants from Armenia by 8th Grade
In terms of 8th grade, the demographic groups most similar to Immigrants from Caribbean are Immigrants from Vietnam (93.5%, a difference of 0.010%), Vietnamese (93.5%, a difference of 0.020%), Cape Verdean (93.5%, a difference of 0.030%), Immigrants from Bangladesh (93.6%, a difference of 0.070%), and Immigrants from Cambodia (93.3%, a difference of 0.21%). Similarly, the demographic groups most similar to Immigrants from Armenia are Honduran (92.3%, a difference of 0.010%), Immigrants from Cabo Verde (92.4%, a difference of 0.090%), Immigrants from Nicaragua (92.5%, a difference of 0.15%), Immigrants from the Azores (92.5%, a difference of 0.18%), and Central American Indian (92.7%, a difference of 0.43%).
| Demographics | Rating | Rank | 8th Grade |
| Immigrants | Bangladesh | 0.0 /100 | #311 | Tragic 93.6% |
| Cape Verdeans | 0.0 /100 | #312 | Tragic 93.5% |
| Immigrants | Caribbean | 0.0 /100 | #313 | Tragic 93.5% |
| Immigrants | Vietnam | 0.0 /100 | #314 | Tragic 93.5% |
| Vietnamese | 0.0 /100 | #315 | Tragic 93.5% |
| Immigrants | Cambodia | 0.0 /100 | #316 | Tragic 93.3% |
| Immigrants | Ecuador | 0.0 /100 | #317 | Tragic 93.3% |
| Puerto Ricans | 0.0 /100 | #318 | Tragic 93.2% |
| Immigrants | Cuba | 0.0 /100 | #319 | Tragic 93.2% |
| Immigrants | Fiji | 0.0 /100 | #320 | Tragic 93.2% |
| Belizeans | 0.0 /100 | #321 | Tragic 93.1% |
| Nicaraguans | 0.0 /100 | #322 | Tragic 93.0% |
| Immigrants | Belize | 0.0 /100 | #323 | Tragic 92.9% |
| Nepalese | 0.0 /100 | #324 | Tragic 92.8% |
| Dominicans | 0.0 /100 | #325 | Tragic 92.8% |
| Central American Indians | 0.0 /100 | #326 | Tragic 92.7% |
| Immigrants | Azores | 0.0 /100 | #327 | Tragic 92.5% |
| Immigrants | Nicaragua | 0.0 /100 | #328 | Tragic 92.5% |
| Immigrants | Cabo Verde | 0.0 /100 | #329 | Tragic 92.4% |
| Immigrants | Armenia | 0.0 /100 | #330 | Tragic 92.3% |
| Hondurans | 0.0 /100 | #331 | Tragic 92.3% |