Immigrants from Burma/Myanmar vs Immigrants from Nicaragua 6th Grade
COMPARE
Immigrants from Burma/Myanmar
Immigrants from Nicaragua
6th Grade
6th Grade Comparison
Immigrants from Burma/Myanmar
Immigrants from Nicaragua
95.7%
6TH GRADE
0.0/ 100
METRIC RATING
302nd/ 347
METRIC RANK
95.1%
6TH GRADE
0.0/ 100
METRIC RATING
325th/ 347
METRIC RANK
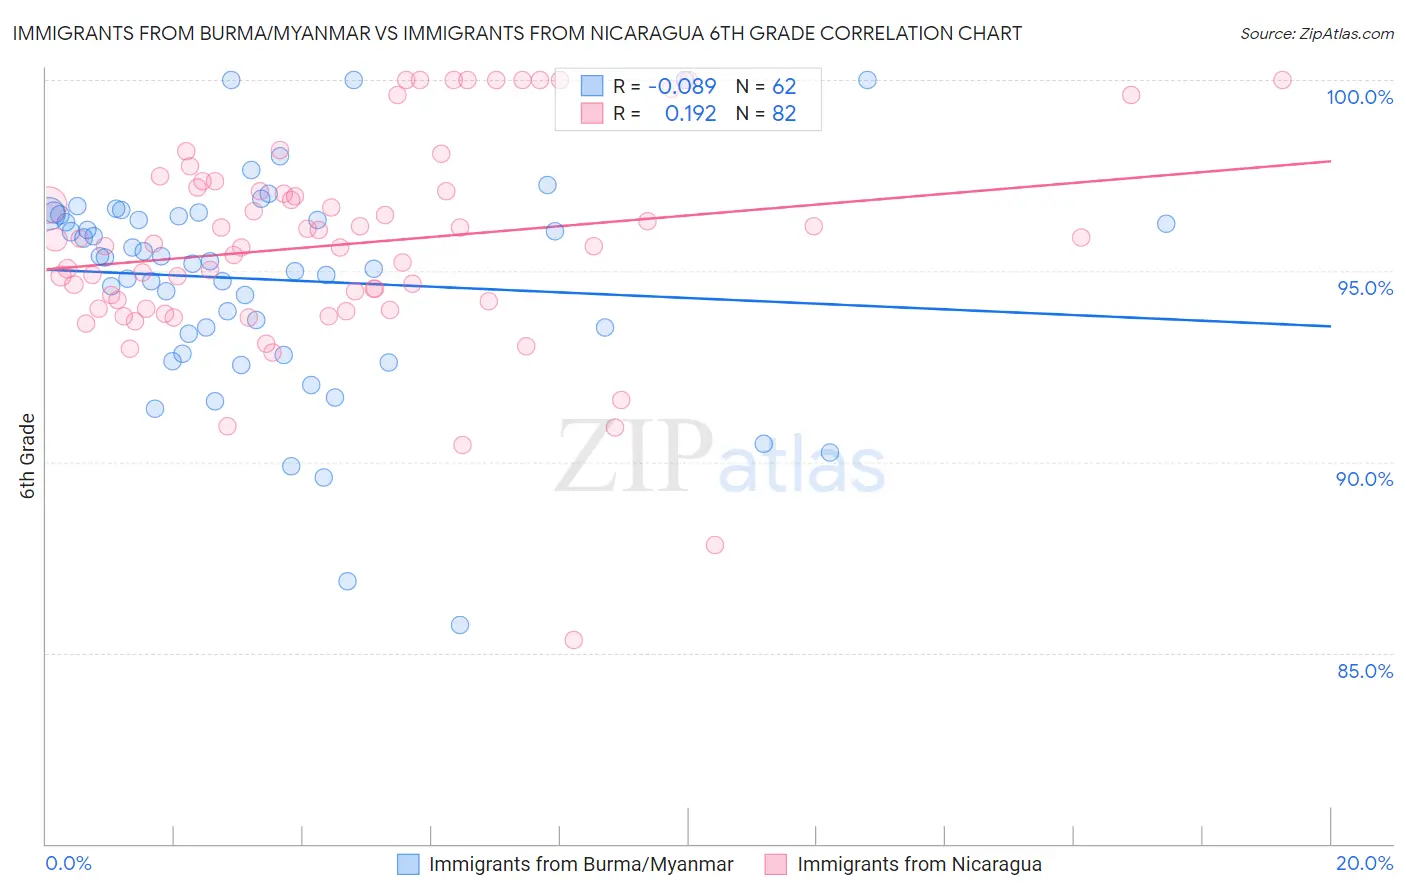
Immigrants from Burma/Myanmar vs Immigrants from Nicaragua 6th Grade Correlation Chart
The statistical analysis conducted on geographies consisting of 172,326,083 people shows a slight negative correlation between the proportion of Immigrants from Burma/Myanmar and percentage of population with at least 6th grade education in the United States with a correlation coefficient (R) of -0.089 and weighted average of 95.7%. Similarly, the statistical analysis conducted on geographies consisting of 236,341,411 people shows a poor positive correlation between the proportion of Immigrants from Nicaragua and percentage of population with at least 6th grade education in the United States with a correlation coefficient (R) of 0.192 and weighted average of 95.1%, a difference of 0.65%.
6th Grade Correlation Summary
| Measurement | Immigrants from Burma/Myanmar | Immigrants from Nicaragua |
| Minimum | 85.7% | 85.3% |
| Maximum | 100.0% | 100.0% |
| Range | 14.3% | 14.7% |
| Mean | 94.8% | 95.7% |
| Median | 95.3% | 95.7% |
| Interquartile 25% (IQ1) | 93.4% | 94.0% |
| Interquartile 75% (IQ3) | 96.5% | 97.2% |
| Interquartile Range (IQR) | 3.1% | 3.1% |
| Standard Deviation (Sample) | 2.8% | 2.8% |
| Standard Deviation (Population) | 2.8% | 2.8% |
Similar Demographics by 6th Grade
Demographics Similar to Immigrants from Burma/Myanmar by 6th Grade
In terms of 6th grade, the demographic groups most similar to Immigrants from Burma/Myanmar are Immigrants from Dominica (95.7%, a difference of 0.020%), Immigrants (95.7%, a difference of 0.020%), Immigrants from Laos (95.7%, a difference of 0.030%), Sri Lankan (95.8%, a difference of 0.050%), and Bangladeshi (95.7%, a difference of 0.070%).
| Demographics | Rating | Rank | 6th Grade |
| Immigrants | Grenada | 0.0 /100 | #295 | Tragic 95.9% |
| Immigrants | South Eastern Asia | 0.0 /100 | #296 | Tragic 95.9% |
| Haitians | 0.0 /100 | #297 | Tragic 95.8% |
| Sri Lankans | 0.0 /100 | #298 | Tragic 95.8% |
| Immigrants | Laos | 0.0 /100 | #299 | Tragic 95.7% |
| Immigrants | Dominica | 0.0 /100 | #300 | Tragic 95.7% |
| Immigrants | Immigrants | 0.0 /100 | #301 | Tragic 95.7% |
| Immigrants | Burma/Myanmar | 0.0 /100 | #302 | Tragic 95.7% |
| Bangladeshis | 0.0 /100 | #303 | Tragic 95.7% |
| Indonesians | 0.0 /100 | #304 | Tragic 95.6% |
| Immigrants | Cuba | 0.0 /100 | #305 | Tragic 95.6% |
| Immigrants | Haiti | 0.0 /100 | #306 | Tragic 95.6% |
| Guyanese | 0.0 /100 | #307 | Tragic 95.6% |
| Immigrants | Caribbean | 0.0 /100 | #308 | Tragic 95.6% |
| Puerto Ricans | 0.0 /100 | #309 | Tragic 95.5% |
Demographics Similar to Immigrants from Nicaragua by 6th Grade
In terms of 6th grade, the demographic groups most similar to Immigrants from Nicaragua are Cape Verdean (95.1%, a difference of 0.030%), Central American Indian (95.1%, a difference of 0.060%), Immigrants from Cambodia (95.2%, a difference of 0.070%), Hispanic or Latino (95.0%, a difference of 0.070%), and Mexican American Indian (95.0%, a difference of 0.10%).
| Demographics | Rating | Rank | 6th Grade |
| Belizeans | 0.0 /100 | #318 | Tragic 95.3% |
| Immigrants | Belize | 0.0 /100 | #319 | Tragic 95.3% |
| Immigrants | Ecuador | 0.0 /100 | #320 | Tragic 95.3% |
| Immigrants | Fiji | 0.0 /100 | #321 | Tragic 95.2% |
| Immigrants | Cambodia | 0.0 /100 | #322 | Tragic 95.2% |
| Central American Indians | 0.0 /100 | #323 | Tragic 95.1% |
| Cape Verdeans | 0.0 /100 | #324 | Tragic 95.1% |
| Immigrants | Nicaragua | 0.0 /100 | #325 | Tragic 95.1% |
| Hispanics or Latinos | 0.0 /100 | #326 | Tragic 95.0% |
| Mexican American Indians | 0.0 /100 | #327 | Tragic 95.0% |
| Hondurans | 0.0 /100 | #328 | Tragic 95.0% |
| Dominicans | 0.0 /100 | #329 | Tragic 94.9% |
| Nepalese | 0.0 /100 | #330 | Tragic 94.9% |
| Immigrants | Armenia | 0.0 /100 | #331 | Tragic 94.9% |
| Immigrants | Honduras | 0.0 /100 | #332 | Tragic 94.8% |