Immigrants from Burma/Myanmar vs Immigrants from Jamaica Kindergarten

COMPARE

Immigrants from Burma/Myanmar
Race
Ancestry
AfghanAfricanAlaska NativeAlaskan AthabascanAlbanianAleutAlsatianAmericanApacheArabArapahoArgentineanArmenianAssyrian/Chaldean/SyriacAustralianAustrianBahamianBangladeshiBarbadianBasqueBelgianBelizeanBermudanBhutaneseBlackfeetBolivianBrazilianBritishBritish West IndianBulgarianBurmeseCajunCambodianCanadianCape VerdeanCarpatho RusynCelticCentral AmericanCentral American IndianCherokeeCheyenneChickasawChileanChineseChippewaChoctawColombianColvilleComancheCosta RicanCreeCreekCroatianCrowCubanCypriotCzechCzechoslovakianDanishDelawareDominicanDutchDutch West IndianEastern EuropeanEcuadorianEgyptianEnglishEstonianEthiopianEuropeanFijianFilipinoFinnishFrenchFrench American IndianFrench CanadianGermanGerman RussianGhanaianGreekGuamanian/ChamorroGuatemalanGuyaneseHaitianHmongHonduranHopiHoumaHungarianIcelanderIndian (Asian)IndonesianInupiatIranianIraqiIrishIroquoisIsraeliItalianJamaicanJapaneseJordanianKenyanKiowaKoreanLaotianLatvianLebaneseLiberianLithuanianLumbeeLuxembourgerMacedonianMalaysianMalteseMarshalleseMenomineeMexicanMexican American IndianMongolianMoroccanNative HawaiianNavajoNepaleseNew ZealanderNicaraguanNigerianNorthern EuropeanNorwegianOkinawanOsageOttawaPaiutePakistaniPalestinianPanamanianParaguayanPennsylvania GermanPeruvianPimaPolishPortuguesePotawatomiPuebloPuerto RicanPuget Sound SalishRomanianRussianSalvadoranSamoanScandinavianScotch-IrishScottishSeminoleSenegaleseSerbianShoshoneSierra LeoneanSiouxSlavicSlovakSloveneSomaliSouth AfricanSouth AmericanSouth American IndianSoviet UnionSpaniardSpanishSpanish AmericanSpanish American IndianSri LankanSubsaharan AfricanSudaneseSwedishSwissSyrianTaiwaneseThaiTlingit-HaidaTohono O'OdhamTonganTrinidadian and TobagonianTsimshianTurkishU.S. Virgin IslanderUgandanUkrainianUruguayanUteVenezuelanVietnameseWelshWest IndianYakamaYaquiYugoslavianYumanYup'ikZimbabwean
Immigration
NonimmigrantsImmigrantsAfghanistanAfricaAlbaniaArgentinaArmeniaAsiaAustraliaAustriaBahamasBangladeshBarbadosBelarusBelgiumBelizeBoliviaBosnia and HerzegovinaBrazilBulgariaBurma/MyanmarCabo VerdeCambodiaCameroonCanadaCaribbeanCentral AmericaChileChinaColombiaCongoCosta RicaCroatiaCubaCzechoslovakiaDenmarkDominicaDominican RepublicEastern AfricaEastern AsiaEastern EuropeEcuadorEgyptEl SalvadorEnglandEritreaEthiopiaEuropeFijiFranceGermanyGhanaGreeceGrenadaGuatemalaGuyanaHaitiHondurasHong KongHungaryIndiaIndonesiaIranIraqIrelandIsraelItalyJapanJordanKazakhstanKenyaKoreaKuwaitLaosLatin AmericaLatviaLebanonLiberiaLithuaniaMalaysiaMexicoMicronesiaMiddle AfricaMoldovaMoroccoNepalNetherlandsNicaraguaNigeriaNorth AmericaNorth MacedoniaNorthern AfricaNorthern EuropeNorwayOceaniaPakistanPanamaPeruPhilippinesPolandPortugalRomaniaRussiaSaudi ArabiaScotlandSenegalSerbiaSierra LeoneSingaporeSomaliaSouth AfricaSouth AmericaSouth Central AsiaSouth Eastern AsiaSouthern EuropeSpainSri LankaSt. Vincent and the GrenadinesSudanSwedenSwitzerlandSyriaTaiwanThailandTrinidad and TobagoTurkeyUgandaUkraineUruguayUzbekistanVenezuelaVietnamWest IndiesWestern AfricaWestern AsiaWestern EuropeYemenZaireZimbabweAzores
Immigrants from Jamaica
Race
Ancestry
AfghanAfricanAlaska NativeAlaskan AthabascanAlbanianAleutAlsatianAmericanApacheArabArapahoArgentineanArmenianAssyrian/Chaldean/SyriacAustralianAustrianBahamianBangladeshiBarbadianBasqueBelgianBelizeanBermudanBhutaneseBlackfeetBolivianBrazilianBritishBritish West IndianBulgarianBurmeseCajunCambodianCanadianCape VerdeanCarpatho RusynCelticCentral AmericanCentral American IndianCherokeeCheyenneChickasawChileanChineseChippewaChoctawColombianColvilleComancheCosta RicanCreeCreekCroatianCrowCubanCypriotCzechCzechoslovakianDanishDelawareDominicanDutchDutch West IndianEastern EuropeanEcuadorianEgyptianEnglishEstonianEthiopianEuropeanFijianFilipinoFinnishFrenchFrench American IndianFrench CanadianGermanGerman RussianGhanaianGreekGuamanian/ChamorroGuatemalanGuyaneseHaitianHmongHonduranHopiHoumaHungarianIcelanderIndian (Asian)IndonesianInupiatIranianIraqiIrishIroquoisIsraeliItalianJamaicanJapaneseJordanianKenyanKiowaKoreanLaotianLatvianLebaneseLiberianLithuanianLumbeeLuxembourgerMacedonianMalaysianMalteseMarshalleseMenomineeMexicanMexican American IndianMongolianMoroccanNative HawaiianNavajoNepaleseNew ZealanderNicaraguanNigerianNorthern EuropeanNorwegianOkinawanOsageOttawaPaiutePakistaniPalestinianPanamanianParaguayanPennsylvania GermanPeruvianPimaPolishPortuguesePotawatomiPuebloPuerto RicanPuget Sound SalishRomanianRussianSalvadoranSamoanScandinavianScotch-IrishScottishSeminoleSenegaleseSerbianShoshoneSierra LeoneanSiouxSlavicSlovakSloveneSomaliSouth AfricanSouth AmericanSouth American IndianSoviet UnionSpaniardSpanishSpanish AmericanSpanish American IndianSri LankanSubsaharan AfricanSudaneseSwedishSwissSyrianTaiwaneseThaiTlingit-HaidaTohono O'OdhamTonganTrinidadian and TobagonianTsimshianTurkishU.S. Virgin IslanderUgandanUkrainianUruguayanUteVenezuelanVietnameseWelshWest IndianYakamaYaquiYugoslavianYumanYup'ikZimbabwean
Immigration
NonimmigrantsImmigrantsAfghanistanAfricaAlbaniaArgentinaArmeniaAsiaAustraliaAustriaBahamasBangladeshBarbadosBelarusBelgiumBelizeBoliviaBosnia and HerzegovinaBrazilBulgariaCabo VerdeCambodiaCameroonCanadaCaribbeanCentral AmericaChileChinaColombiaCongoCosta RicaCroatiaCubaCzechoslovakiaDenmarkDominicaDominican RepublicEastern AfricaEastern AsiaEastern EuropeEcuadorEgyptEl SalvadorEnglandEritreaEthiopiaEuropeFijiFranceGermanyGhanaGreeceGrenadaGuatemalaGuyanaHaitiHondurasHong KongHungaryIndiaIndonesiaIranIraqIrelandIsraelItalyJamaicaJapanJordanKazakhstanKenyaKoreaKuwaitLaosLatin AmericaLatviaLebanonLiberiaLithuaniaMalaysiaMexicoMicronesiaMiddle AfricaMoldovaMoroccoNepalNetherlandsNicaraguaNigeriaNorth AmericaNorth MacedoniaNorthern AfricaNorthern EuropeNorwayOceaniaPakistanPanamaPeruPhilippinesPolandPortugalRomaniaRussiaSaudi ArabiaScotlandSenegalSerbiaSierra LeoneSingaporeSomaliaSouth AfricaSouth AmericaSouth Central AsiaSouth Eastern AsiaSouthern EuropeSpainSri LankaSt. Vincent and the GrenadinesSudanSwedenSwitzerlandSyriaTaiwanThailandTrinidad and TobagoTurkeyUgandaUkraineUruguayUzbekistanVenezuelaVietnamWest IndiesWestern AfricaWestern AsiaWestern EuropeYemenZaireZimbabweAzores
Kindergarten
Income
Poverty
Unemployment
Labor Participation
Family Structure
Vehicle Availability
Education Level
Disability

Kindergarten Comparison

Immigrants from Burma/Myanmar

Immigrants from Jamaica

Tragic
Tragic
96.8%
KINDERGARTEN
0.0/ 100
METRIC RATING
320th/ 347
METRIC RANK
97.5%
KINDERGARTEN
0.2/ 100
METRIC RATING
270th/ 347
METRIC RANK

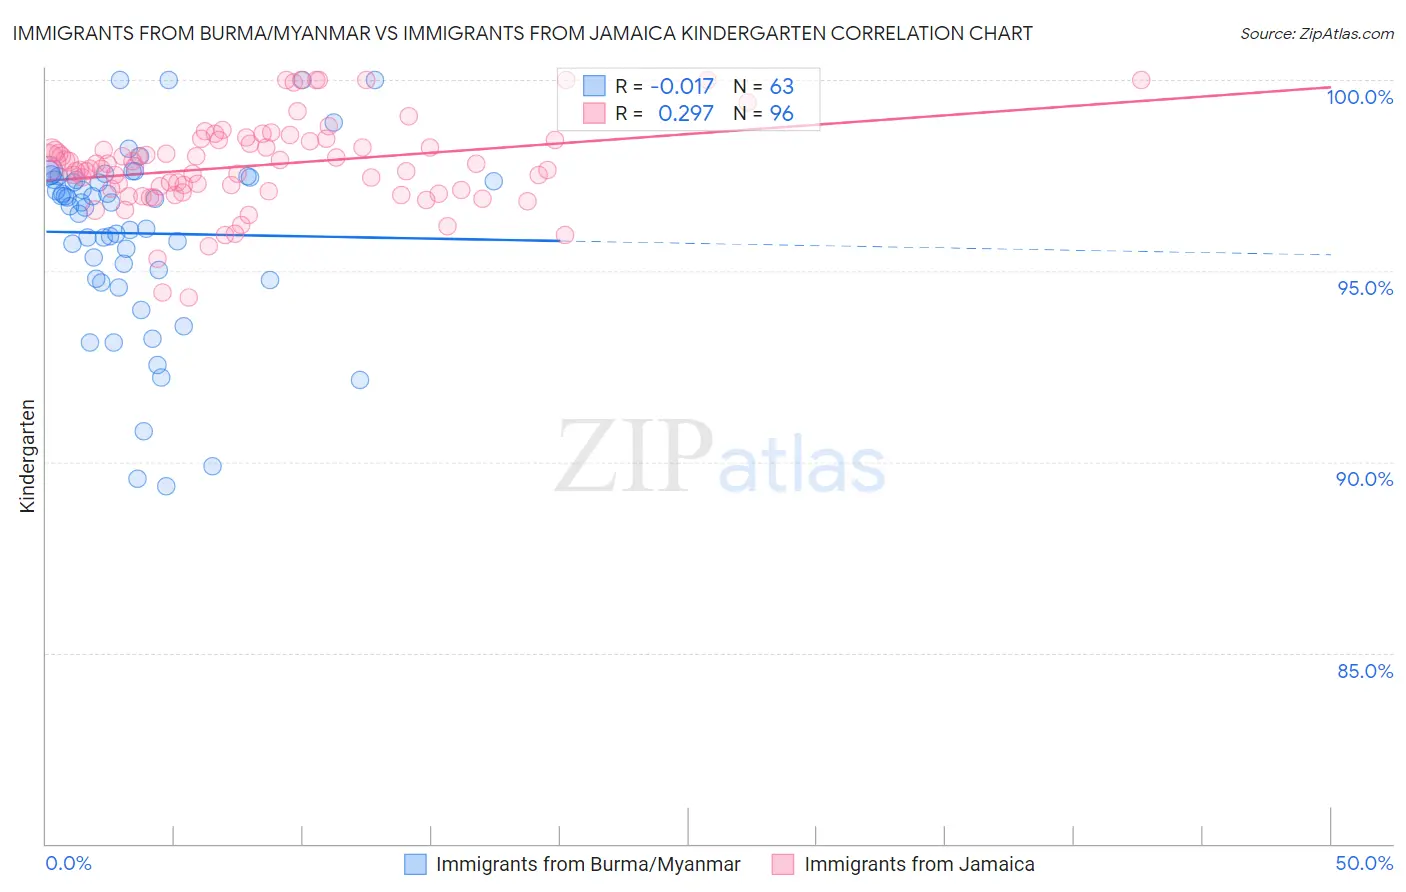
Immigrants from Burma/Myanmar vs Immigrants from Jamaica Kindergarten Correlation Chart

The statistical analysis conducted on geographies consisting of 172,338,093 people shows no correlation between the proportion of Immigrants from Burma/Myanmar and percentage of population with at least kindergarten education in the United States with a correlation coefficient (R) of -0.017 and weighted average of 96.8%. Similarly, the statistical analysis conducted on geographies consisting of 301,830,081 people shows a weak positive correlation between the proportion of Immigrants from Jamaica and percentage of population with at least kindergarten education in the United States with a correlation coefficient (R) of 0.297 and weighted average of 97.5%, a difference of 0.67%.
Immigrants from Burma/Myanmar vs Immigrants from Jamaica Kindergarten

Kindergarten Correlation Summary

MeasurementImmigrants from Burma/MyanmarImmigrants from Jamaica
Minimum89.4%94.3%
Maximum100.0%100.0%
Range10.6%5.7%
Mean96.0%97.8%
Median96.8%97.8%
Interquartile 25% (IQ1)94.8%97.1%
Interquartile 75% (IQ3)97.4%98.4%
Interquartile Range (IQR)2.6%1.3%
Standard Deviation (Sample)2.4%1.1%
Standard Deviation (Population)2.4%1.1%

Similar Demographics by Kindergarten

Demographics Similar to Immigrants from Burma/Myanmar by Kindergarten

In terms of kindergarten, the demographic groups most similar to Immigrants from Burma/Myanmar are Immigrants from Guyana (96.8%, a difference of 0.0%), Immigrants from Laos (96.9%, a difference of 0.010%), Immigrants from Bangladesh (96.8%, a difference of 0.010%), Mexican American Indian (96.8%, a difference of 0.020%), and Immigrants from Honduras (96.8%, a difference of 0.030%).
DemographicsRating | RankKindergarten
Cape Verdeans
0.0
/100
|
#313
Tragic
96.9%
Hondurans
0.0
/100
|
#314
Tragic
96.9%
Immigrants | Belize
0.0
/100
|
#315
Tragic
96.9%
Immigrants | Nicaragua
0.0
/100
|
#316
Tragic
96.9%
Immigrants | Ecuador
0.0
/100
|
#317
Tragic
96.9%
Immigrants | Laos
0.0
/100
|
#318
Tragic
96.9%
Immigrants | Guyana
0.0
/100
|
#319
Tragic
96.8%
Immigrants | Burma/Myanmar
0.0
/100
|
#320
Tragic
96.8%
Immigrants | Bangladesh
0.0
/100
|
#321
Tragic
96.8%
Mexican American Indians
0.0
/100
|
#322
Tragic
96.8%
Immigrants | Honduras
0.0
/100
|
#323
Tragic
96.8%
Vietnamese
0.0
/100
|
#324
Tragic
96.8%
Indonesians
0.0
/100
|
#325
Tragic
96.8%
Dominicans
0.0
/100
|
#326
Tragic
96.8%
Mexicans
0.0
/100
|
#327
Tragic
96.7%

Demographics Similar to Immigrants from Jamaica by Kindergarten

In terms of kindergarten, the demographic groups most similar to Immigrants from Jamaica are West Indian (97.5%, a difference of 0.020%), Immigrants from Peru (97.5%, a difference of 0.020%), Immigrants from Bolivia (97.5%, a difference of 0.020%), Cuban (97.5%, a difference of 0.030%), and Immigrants from Sierra Leone (97.5%, a difference of 0.030%).
DemographicsRating | RankKindergarten
Immigrants | South America
0.4
/100
|
#263
Tragic
97.5%
Assyrians/Chaldeans/Syriacs
0.4
/100
|
#264
Tragic
97.5%
Cubans
0.3
/100
|
#265
Tragic
97.5%
Immigrants | Sierra Leone
0.3
/100
|
#266
Tragic
97.5%
Immigrants | Liberia
0.3
/100
|
#267
Tragic
97.5%
Immigrants | Nigeria
0.3
/100
|
#268
Tragic
97.5%
West Indians
0.3
/100
|
#269
Tragic
97.5%
Immigrants | Jamaica
0.2
/100
|
#270
Tragic
97.5%
Immigrants | Peru
0.2
/100
|
#271
Tragic
97.5%
Immigrants | Bolivia
0.2
/100
|
#272
Tragic
97.5%
Immigrants | China
0.1
/100
|
#273
Tragic
97.4%
Immigrants | Cameroon
0.1
/100
|
#274
Tragic
97.4%
Ghanaians
0.1
/100
|
#275
Tragic
97.4%
Immigrants | Philippines
0.1
/100
|
#276
Tragic
97.4%
Immigrants | Western Africa
0.1
/100
|
#277
Tragic
97.4%