Immigrants from Bulgaria vs Assyrian/Chaldean/Syriac Associate's Degree

COMPARE

Immigrants from Bulgaria
Race
Ancestry
AfghanAfricanAlaska NativeAlaskan AthabascanAlbanianAleutAlsatianAmericanApacheArabArapahoArgentineanArmenianAustralianAustrianBahamianBangladeshiBarbadianBasqueBelgianBelizeanBermudanBhutaneseBlackfeetBolivianBrazilianBritishBritish West IndianBulgarianBurmeseCajunCambodianCanadianCape VerdeanCarpatho RusynCelticCentral AmericanCentral American IndianCherokeeCheyenneChickasawChileanChineseChippewaChoctawColombianColvilleComancheCosta RicanCreeCreekCroatianCrowCubanCypriotCzechCzechoslovakianDanishDelawareDominicanDutchDutch West IndianEastern EuropeanEcuadorianEgyptianEnglishEstonianEthiopianEuropeanFijianFilipinoFinnishFrenchFrench American IndianFrench CanadianGermanGerman RussianGhanaianGreekGuamanian/ChamorroGuatemalanGuyaneseHaitianHmongHonduranHopiHoumaHungarianIcelanderIndian (Asian)IndonesianInupiatIranianIraqiIrishIroquoisIsraeliItalianJamaicanJapaneseJordanianKenyanKiowaKoreanLaotianLatvianLebaneseLiberianLithuanianLumbeeLuxembourgerMacedonianMalaysianMalteseMarshalleseMenomineeMexicanMexican American IndianMongolianMoroccanNative HawaiianNavajoNepaleseNew ZealanderNicaraguanNigerianNorthern EuropeanNorwegianOkinawanOsageOttawaPaiutePakistaniPalestinianPanamanianParaguayanPennsylvania GermanPeruvianPimaPolishPortuguesePotawatomiPuebloPuerto RicanPuget Sound SalishRomanianRussianSalvadoranSamoanScandinavianScotch-IrishScottishSeminoleSenegaleseSerbianShoshoneSierra LeoneanSiouxSlavicSlovakSloveneSomaliSouth AfricanSouth AmericanSouth American IndianSoviet UnionSpaniardSpanishSpanish AmericanSpanish American IndianSri LankanSubsaharan AfricanSudaneseSwedishSwissSyrianTaiwaneseThaiTlingit-HaidaTohono O'OdhamTonganTrinidadian and TobagonianTsimshianTurkishU.S. Virgin IslanderUgandanUkrainianUruguayanUteVenezuelanVietnameseWelshWest IndianYakamaYaquiYugoslavianYumanYup'ikZimbabwean
Immigration
NonimmigrantsImmigrantsAfghanistanAfricaAlbaniaArgentinaArmeniaAsiaAustraliaAustriaBahamasBangladeshBarbadosBelarusBelgiumBelizeBoliviaBosnia and HerzegovinaBrazilBulgariaBurma/MyanmarCabo VerdeCambodiaCameroonCanadaCaribbeanCentral AmericaChileChinaColombiaCongoCosta RicaCroatiaCubaCzechoslovakiaDenmarkDominicaDominican RepublicEastern AfricaEastern AsiaEastern EuropeEcuadorEgyptEl SalvadorEnglandEritreaEthiopiaEuropeFijiFranceGermanyGhanaGreeceGrenadaGuatemalaGuyanaHaitiHondurasHong KongHungaryIndiaIndonesiaIranIraqIrelandIsraelItalyJamaicaJapanJordanKazakhstanKenyaKoreaKuwaitLaosLatin AmericaLatviaLebanonLiberiaLithuaniaMalaysiaMexicoMicronesiaMiddle AfricaMoldovaMoroccoNepalNetherlandsNicaraguaNigeriaNorth AmericaNorth MacedoniaNorthern AfricaNorthern EuropeNorwayOceaniaPakistanPanamaPeruPhilippinesPolandPortugalRomaniaRussiaSaudi ArabiaScotlandSenegalSerbiaSierra LeoneSingaporeSomaliaSouth AfricaSouth AmericaSouth Central AsiaSouth Eastern AsiaSouthern EuropeSpainSri LankaSt. Vincent and the GrenadinesSudanSwedenSwitzerlandSyriaTaiwanThailandTrinidad and TobagoTurkeyUgandaUkraineUruguayUzbekistanVenezuelaVietnamWest IndiesWestern AfricaWestern AsiaWestern EuropeYemenZaireZimbabweAzores
Assyrian/Chaldean/Syriac
Race
Ancestry
AfghanAfricanAlaska NativeAlaskan AthabascanAlbanianAleutAlsatianAmericanApacheArabArapahoArgentineanArmenianAssyrian/Chaldean/SyriacAustralianAustrianBahamianBangladeshiBarbadianBasqueBelgianBelizeanBermudanBhutaneseBlackfeetBolivianBrazilianBritishBritish West IndianBulgarianBurmeseCajunCambodianCanadianCape VerdeanCarpatho RusynCelticCentral AmericanCentral American IndianCherokeeCheyenneChickasawChileanChineseChippewaChoctawColombianColvilleComancheCosta RicanCreeCreekCroatianCrowCubanCypriotCzechCzechoslovakianDanishDelawareDominicanDutchDutch West IndianEastern EuropeanEcuadorianEgyptianEnglishEstonianEthiopianEuropeanFijianFilipinoFinnishFrenchFrench American IndianFrench CanadianGermanGerman RussianGhanaianGreekGuamanian/ChamorroGuatemalanGuyaneseHaitianHmongHonduranHopiHoumaHungarianIcelanderIndian (Asian)IndonesianInupiatIranianIraqiIrishIroquoisIsraeliItalianJamaicanJapaneseJordanianKenyanKiowaKoreanLaotianLatvianLebaneseLiberianLithuanianLumbeeLuxembourgerMacedonianMalaysianMalteseMarshalleseMenomineeMexicanMexican American IndianMongolianMoroccanNative HawaiianNavajoNepaleseNew ZealanderNicaraguanNigerianNorthern EuropeanNorwegianOkinawanOsageOttawaPaiutePakistaniPalestinianPanamanianParaguayanPennsylvania GermanPeruvianPimaPolishPortuguesePotawatomiPuebloPuerto RicanPuget Sound SalishRomanianRussianSalvadoranSamoanScandinavianScotch-IrishScottishSeminoleSenegaleseSerbianShoshoneSierra LeoneanSiouxSlavicSlovakSloveneSomaliSouth AfricanSouth AmericanSouth American IndianSoviet UnionSpaniardSpanishSpanish AmericanSpanish American IndianSri LankanSubsaharan AfricanSudaneseSwedishSwissSyrianTaiwaneseThaiTlingit-HaidaTohono O'OdhamTonganTrinidadian and TobagonianTsimshianTurkishU.S. Virgin IslanderUgandanUkrainianUruguayanUteVenezuelanVietnameseWelshWest IndianYakamaYaquiYugoslavianYumanYup'ikZimbabwean
Immigration
NonimmigrantsImmigrantsAfghanistanAfricaAlbaniaArgentinaArmeniaAsiaAustraliaAustriaBahamasBangladeshBarbadosBelarusBelgiumBelizeBoliviaBosnia and HerzegovinaBrazilBurma/MyanmarCabo VerdeCambodiaCameroonCanadaCaribbeanCentral AmericaChileChinaColombiaCongoCosta RicaCroatiaCubaCzechoslovakiaDenmarkDominicaDominican RepublicEastern AfricaEastern AsiaEastern EuropeEcuadorEgyptEl SalvadorEnglandEritreaEthiopiaEuropeFijiFranceGermanyGhanaGreeceGrenadaGuatemalaGuyanaHaitiHondurasHong KongHungaryIndiaIndonesiaIranIraqIrelandIsraelItalyJamaicaJapanJordanKazakhstanKenyaKoreaKuwaitLaosLatin AmericaLatviaLebanonLiberiaLithuaniaMalaysiaMexicoMicronesiaMiddle AfricaMoldovaMoroccoNepalNetherlandsNicaraguaNigeriaNorth AmericaNorth MacedoniaNorthern AfricaNorthern EuropeNorwayOceaniaPakistanPanamaPeruPhilippinesPolandPortugalRomaniaRussiaSaudi ArabiaScotlandSenegalSerbiaSierra LeoneSingaporeSomaliaSouth AfricaSouth AmericaSouth Central AsiaSouth Eastern AsiaSouthern EuropeSpainSri LankaSt. Vincent and the GrenadinesSudanSwedenSwitzerlandSyriaTaiwanThailandTrinidad and TobagoTurkeyUgandaUkraineUruguayUzbekistanVenezuelaVietnamWest IndiesWestern AfricaWestern AsiaWestern EuropeYemenZaireZimbabweAzores
Associate's Degree
Income
Poverty
Unemployment
Labor Participation
Family Structure
Vehicle Availability
Education Level
Disability

Associate's Degree Comparison

Immigrants from Bulgaria

Assyrians/Chaldeans/Syriacs

Exceptional
Excellent
52.4%
ASSOCIATE'S DEGREE
99.9/ 100
METRIC RATING
46th/ 347
METRIC RANK
48.2%
ASSOCIATE'S DEGREE
89.4/ 100
METRIC RATING
133rd/ 347
METRIC RANK

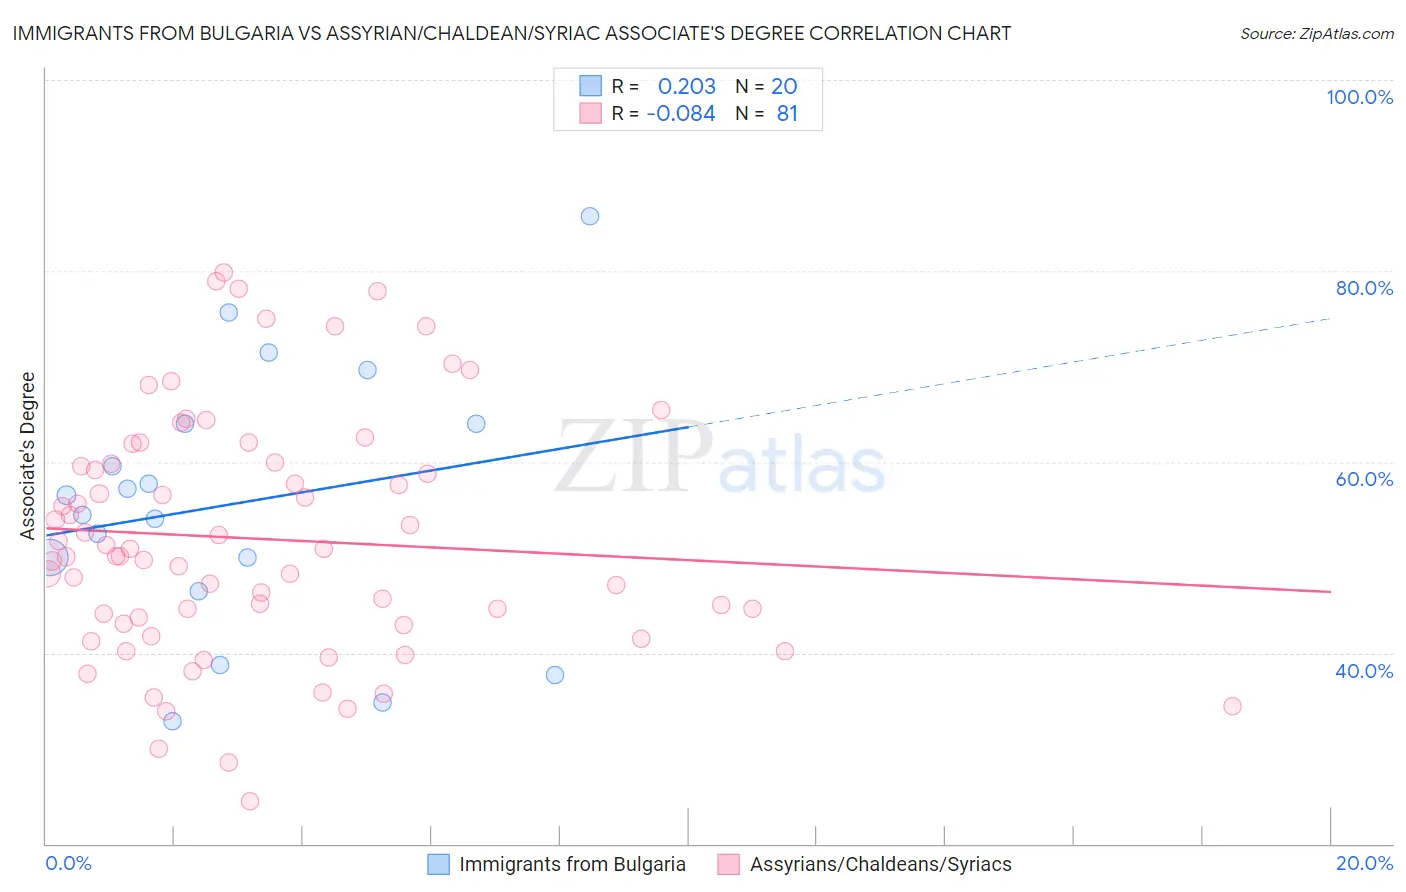
Immigrants from Bulgaria vs Assyrian/Chaldean/Syriac Associate's Degree Correlation Chart

The statistical analysis conducted on geographies consisting of 172,549,252 people shows a weak positive correlation between the proportion of Immigrants from Bulgaria and percentage of population with at least associate's degree education in the United States with a correlation coefficient (R) of 0.203 and weighted average of 52.4%. Similarly, the statistical analysis conducted on geographies consisting of 110,318,304 people shows a slight negative correlation between the proportion of Assyrians/Chaldeans/Syriacs and percentage of population with at least associate's degree education in the United States with a correlation coefficient (R) of -0.084 and weighted average of 48.2%, a difference of 8.6%.
Immigrants from Bulgaria vs Assyrian/Chaldean/Syriac Associate's Degree

Associate's Degree Correlation Summary

MeasurementImmigrants from BulgariaAssyrian/Chaldean/Syriac
Minimum32.8%24.5%
Maximum85.8%79.8%
Range52.9%55.3%
Mean55.7%51.9%
Median55.5%50.1%
Interquartile 25% (IQ1)48.2%43.0%
Interquartile 75% (IQ3)64.0%59.9%
Interquartile Range (IQR)15.8%16.9%
Standard Deviation (Sample)13.8%12.7%
Standard Deviation (Population)13.5%12.6%

Similar Demographics by Associate's Degree

Demographics Similar to Immigrants from Bulgaria by Associate's Degree

In terms of associate's degree, the demographic groups most similar to Immigrants from Bulgaria are Immigrants from Kuwait (52.4%, a difference of 0.010%), Immigrants from Lithuania (52.4%, a difference of 0.13%), Estonian (52.5%, a difference of 0.21%), Immigrants from Norway (52.2%, a difference of 0.27%), and Immigrants from South Africa (52.5%, a difference of 0.30%).
DemographicsRating | RankAssociate's Degree
Immigrants | Belarus
99.9
/100
|
#39
Exceptional
52.8%
Immigrants | Latvia
99.9
/100
|
#40
Exceptional
52.8%
Immigrants | Saudi Arabia
99.9
/100
|
#41
Exceptional
52.6%
Immigrants | Malaysia
99.9
/100
|
#42
Exceptional
52.5%
Immigrants | South Africa
99.9
/100
|
#43
Exceptional
52.5%
Estonians
99.9
/100
|
#44
Exceptional
52.5%
Immigrants | Lithuania
99.9
/100
|
#45
Exceptional
52.4%
Immigrants | Bulgaria
99.9
/100
|
#46
Exceptional
52.4%
Immigrants | Kuwait
99.9
/100
|
#47
Exceptional
52.4%
Immigrants | Norway
99.9
/100
|
#48
Exceptional
52.2%
Immigrants | Austria
99.9
/100
|
#49
Exceptional
52.1%
Asians
99.9
/100
|
#50
Exceptional
52.1%
Immigrants | Greece
99.9
/100
|
#51
Exceptional
52.1%
Bolivians
99.8
/100
|
#52
Exceptional
52.0%
Immigrants | Asia
99.8
/100
|
#53
Exceptional
52.0%

Demographics Similar to Assyrians/Chaldeans/Syriacs by Associate's Degree

In terms of associate's degree, the demographic groups most similar to Assyrians/Chaldeans/Syriacs are Moroccan (48.2%, a difference of 0.020%), Immigrants from Albania (48.2%, a difference of 0.080%), European (48.2%, a difference of 0.080%), Pakistani (48.1%, a difference of 0.26%), and Icelander (48.3%, a difference of 0.27%).
DemographicsRating | RankAssociate's Degree
Immigrants | Syria
92.2
/100
|
#126
Exceptional
48.5%
Immigrants | Uganda
92.1
/100
|
#127
Exceptional
48.5%
Immigrants | Eastern Africa
91.6
/100
|
#128
Exceptional
48.4%
Swedes
91.5
/100
|
#129
Exceptional
48.4%
Immigrants | Jordan
91.2
/100
|
#130
Exceptional
48.4%
Icelanders
90.8
/100
|
#131
Exceptional
48.3%
Immigrants | Albania
89.9
/100
|
#132
Excellent
48.2%
Assyrians/Chaldeans/Syriacs
89.4
/100
|
#133
Excellent
48.2%
Moroccans
89.3
/100
|
#134
Excellent
48.2%
Europeans
89.0
/100
|
#135
Excellent
48.2%
Pakistanis
88.0
/100
|
#136
Excellent
48.1%
Immigrants | Eritrea
87.8
/100
|
#137
Excellent
48.1%
Poles
87.3
/100
|
#138
Excellent
48.0%
Slovenes
85.1
/100
|
#139
Excellent
47.9%
Immigrants | Southern Europe
84.4
/100
|
#140
Excellent
47.8%