Immigrants from Bangladesh vs Assyrian/Chaldean/Syriac Associate's Degree
COMPARE
Immigrants from Bangladesh
Assyrian/Chaldean/Syriac
Associate's Degree
Associate's Degree Comparison
Immigrants from Bangladesh
Assyrians/Chaldeans/Syriacs
45.2%
ASSOCIATE'S DEGREE
21.3/ 100
METRIC RATING
198th/ 347
METRIC RANK
48.2%
ASSOCIATE'S DEGREE
89.4/ 100
METRIC RATING
133rd/ 347
METRIC RANK
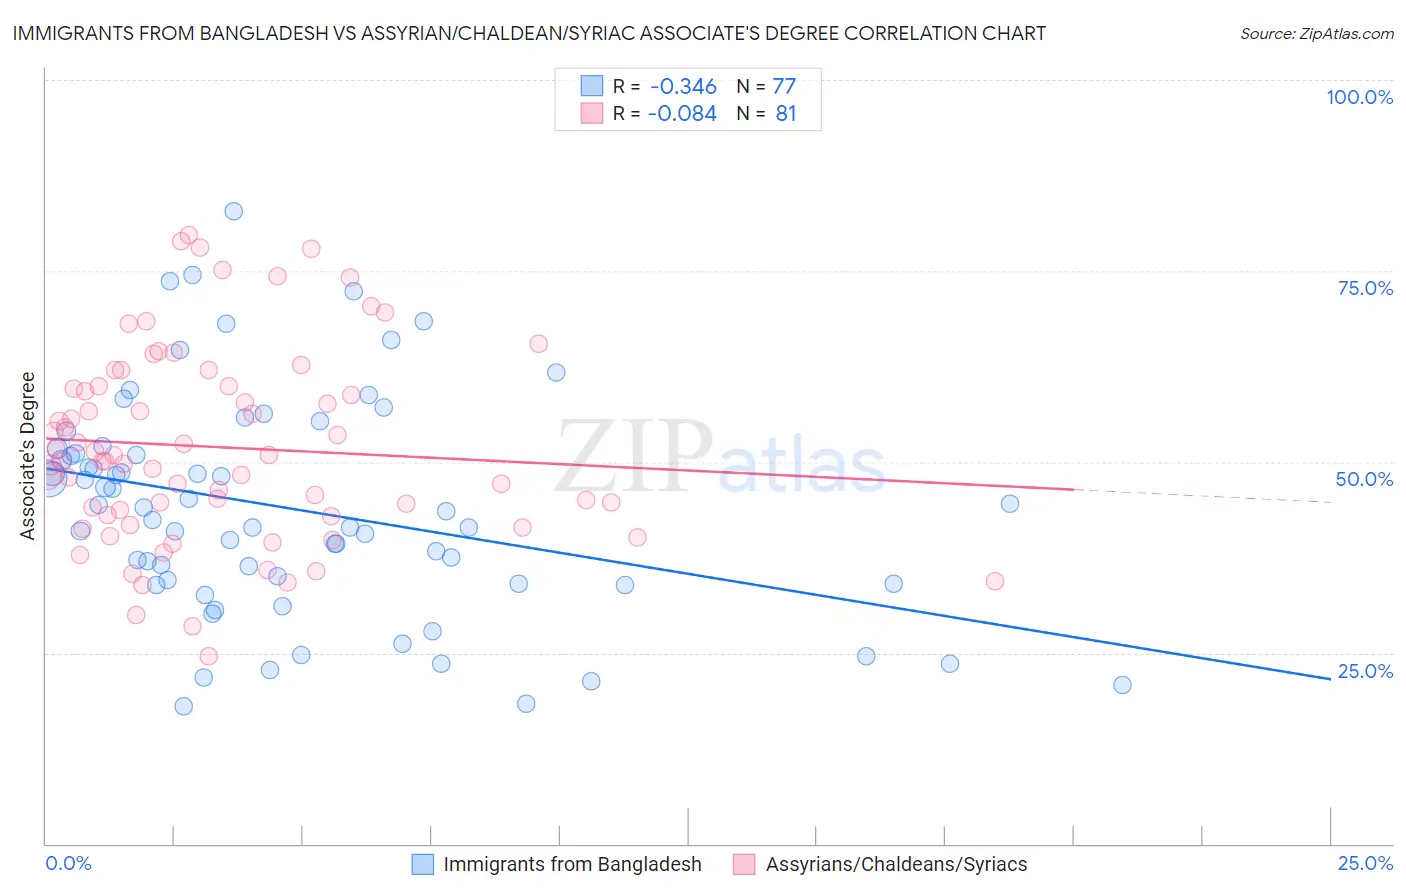
Immigrants from Bangladesh vs Assyrian/Chaldean/Syriac Associate's Degree Correlation Chart
The statistical analysis conducted on geographies consisting of 203,673,511 people shows a mild negative correlation between the proportion of Immigrants from Bangladesh and percentage of population with at least associate's degree education in the United States with a correlation coefficient (R) of -0.346 and weighted average of 45.2%. Similarly, the statistical analysis conducted on geographies consisting of 110,318,304 people shows a slight negative correlation between the proportion of Assyrians/Chaldeans/Syriacs and percentage of population with at least associate's degree education in the United States with a correlation coefficient (R) of -0.084 and weighted average of 48.2%, a difference of 6.6%.
Associate's Degree Correlation Summary
| Measurement | Immigrants from Bangladesh | Assyrian/Chaldean/Syriac |
| Minimum | 18.0% | 24.5% |
| Maximum | 82.8% | 79.8% |
| Range | 64.8% | 55.3% |
| Mean | 43.9% | 51.9% |
| Median | 43.6% | 50.1% |
| Interquartile 25% (IQ1) | 34.0% | 43.0% |
| Interquartile 75% (IQ3) | 51.4% | 59.9% |
| Interquartile Range (IQR) | 17.4% | 16.9% |
| Standard Deviation (Sample) | 14.3% | 12.7% |
| Standard Deviation (Population) | 14.2% | 12.6% |
Similar Demographics by Associate's Degree
Demographics Similar to Immigrants from Bangladesh by Associate's Degree
In terms of associate's degree, the demographic groups most similar to Immigrants from Bangladesh are Immigrants from Senegal (45.2%, a difference of 0.020%), Senegalese (45.2%, a difference of 0.030%), Immigrants from Vietnam (45.2%, a difference of 0.060%), Scotch-Irish (45.3%, a difference of 0.10%), and Spaniard (45.2%, a difference of 0.11%).
| Demographics | Rating | Rank | Associate's Degree |
| Koreans | 33.8 /100 | #191 | Fair 45.8% |
| Celtics | 33.3 /100 | #192 | Fair 45.8% |
| Immigrants | Cameroon | 31.0 /100 | #193 | Fair 45.7% |
| Immigrants | Peru | 27.6 /100 | #194 | Fair 45.5% |
| Germans | 26.5 /100 | #195 | Fair 45.5% |
| French | 25.6 /100 | #196 | Fair 45.4% |
| Scotch-Irish | 22.3 /100 | #197 | Fair 45.3% |
| Immigrants | Bangladesh | 21.3 /100 | #198 | Fair 45.2% |
| Immigrants | Senegal | 21.2 /100 | #199 | Fair 45.2% |
| Senegalese | 21.1 /100 | #200 | Fair 45.2% |
| Immigrants | Vietnam | 20.8 /100 | #201 | Fair 45.2% |
| Spaniards | 20.4 /100 | #202 | Fair 45.2% |
| Immigrants | South Eastern Asia | 20.2 /100 | #203 | Fair 45.2% |
| Nigerians | 19.1 /100 | #204 | Poor 45.1% |
| Immigrants | Thailand | 18.9 /100 | #205 | Poor 45.1% |
Demographics Similar to Assyrians/Chaldeans/Syriacs by Associate's Degree
In terms of associate's degree, the demographic groups most similar to Assyrians/Chaldeans/Syriacs are Moroccan (48.2%, a difference of 0.020%), Immigrants from Albania (48.2%, a difference of 0.080%), European (48.2%, a difference of 0.080%), Pakistani (48.1%, a difference of 0.26%), and Icelander (48.3%, a difference of 0.27%).
| Demographics | Rating | Rank | Associate's Degree |
| Immigrants | Syria | 92.2 /100 | #126 | Exceptional 48.5% |
| Immigrants | Uganda | 92.1 /100 | #127 | Exceptional 48.5% |
| Immigrants | Eastern Africa | 91.6 /100 | #128 | Exceptional 48.4% |
| Swedes | 91.5 /100 | #129 | Exceptional 48.4% |
| Immigrants | Jordan | 91.2 /100 | #130 | Exceptional 48.4% |
| Icelanders | 90.8 /100 | #131 | Exceptional 48.3% |
| Immigrants | Albania | 89.9 /100 | #132 | Excellent 48.2% |
| Assyrians/Chaldeans/Syriacs | 89.4 /100 | #133 | Excellent 48.2% |
| Moroccans | 89.3 /100 | #134 | Excellent 48.2% |
| Europeans | 89.0 /100 | #135 | Excellent 48.2% |
| Pakistanis | 88.0 /100 | #136 | Excellent 48.1% |
| Immigrants | Eritrea | 87.8 /100 | #137 | Excellent 48.1% |
| Poles | 87.3 /100 | #138 | Excellent 48.0% |
| Slovenes | 85.1 /100 | #139 | Excellent 47.9% |
| Immigrants | Southern Europe | 84.4 /100 | #140 | Excellent 47.8% |