Immigrants from Brazil vs Belgian 8th Grade
COMPARE
Immigrants from Brazil
Belgian
8th Grade
8th Grade Comparison
Immigrants from Brazil
Belgians
95.7%
8TH GRADE
45.4/ 100
METRIC RATING
179th/ 347
METRIC RANK
97.0%
8TH GRADE
100.0/ 100
METRIC RATING
36th/ 347
METRIC RANK
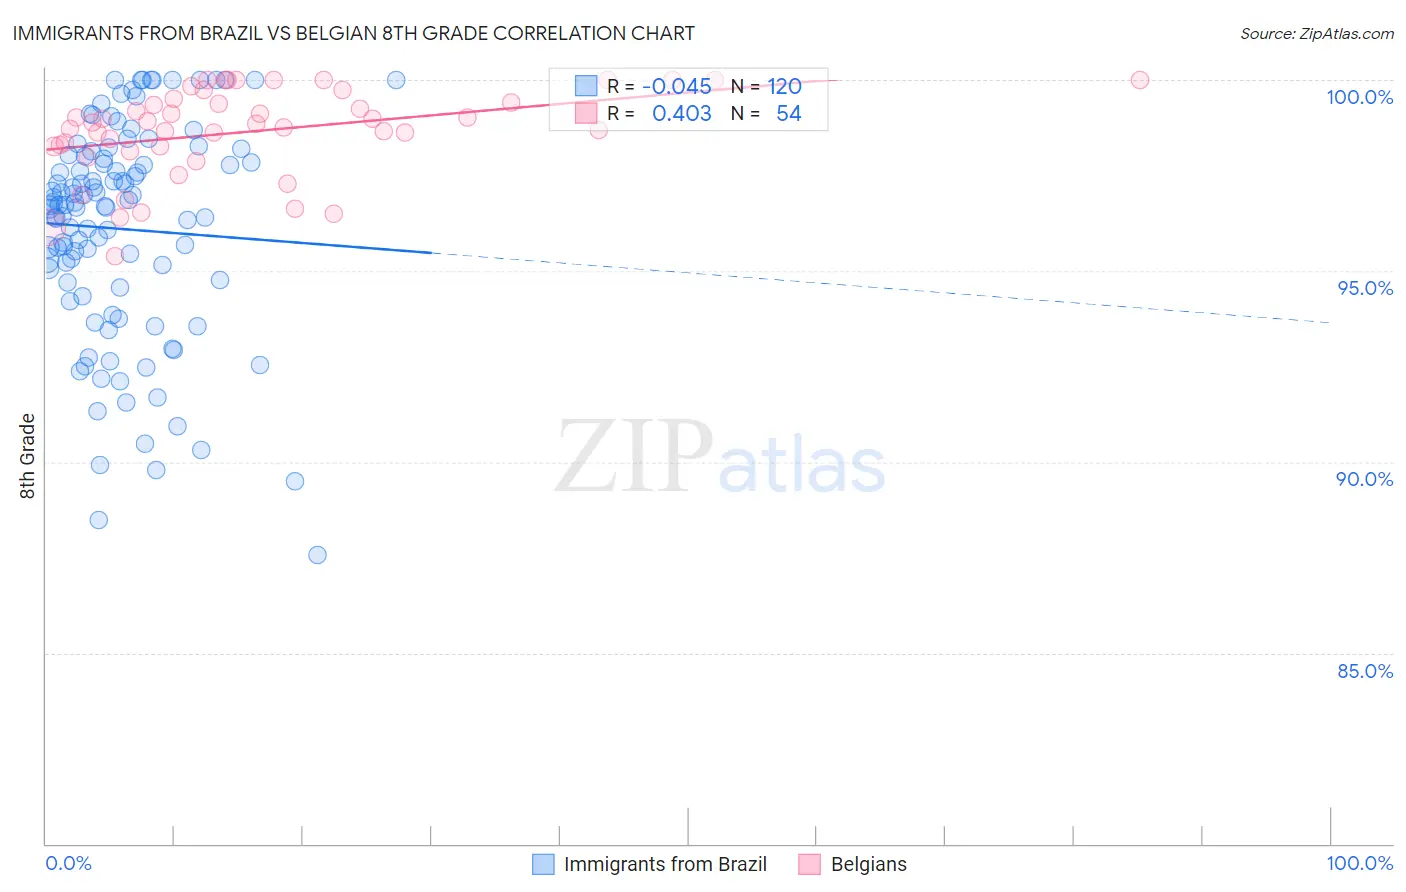
Immigrants from Brazil vs Belgian 8th Grade Correlation Chart
The statistical analysis conducted on geographies consisting of 343,018,979 people shows no correlation between the proportion of Immigrants from Brazil and percentage of population with at least 8th grade education in the United States with a correlation coefficient (R) of -0.045 and weighted average of 95.7%. Similarly, the statistical analysis conducted on geographies consisting of 356,016,627 people shows a moderate positive correlation between the proportion of Belgians and percentage of population with at least 8th grade education in the United States with a correlation coefficient (R) of 0.403 and weighted average of 97.0%, a difference of 1.3%.
8th Grade Correlation Summary
| Measurement | Immigrants from Brazil | Belgian |
| Minimum | 87.6% | 95.4% |
| Maximum | 100.0% | 100.0% |
| Range | 12.4% | 4.6% |
| Mean | 96.1% | 98.7% |
| Median | 96.7% | 98.9% |
| Interquartile 25% (IQ1) | 94.6% | 98.3% |
| Interquartile 75% (IQ3) | 98.0% | 99.5% |
| Interquartile Range (IQR) | 3.3% | 1.2% |
| Standard Deviation (Sample) | 2.8% | 1.2% |
| Standard Deviation (Population) | 2.8% | 1.2% |
Similar Demographics by 8th Grade
Demographics Similar to Immigrants from Brazil by 8th Grade
In terms of 8th grade, the demographic groups most similar to Immigrants from Brazil are Marshallese (95.7%, a difference of 0.010%), Venezuelan (95.7%, a difference of 0.010%), Pakistani (95.7%, a difference of 0.020%), Chilean (95.7%, a difference of 0.030%), and Immigrants from Albania (95.7%, a difference of 0.030%).
| Demographics | Rating | Rank | 8th Grade |
| Immigrants | Korea | 57.9 /100 | #172 | Average 95.8% |
| Mongolians | 53.0 /100 | #173 | Average 95.8% |
| Chileans | 50.0 /100 | #174 | Average 95.7% |
| Immigrants | Albania | 49.6 /100 | #175 | Average 95.7% |
| Pakistanis | 48.8 /100 | #176 | Average 95.7% |
| Marshallese | 47.6 /100 | #177 | Average 95.7% |
| Venezuelans | 47.5 /100 | #178 | Average 95.7% |
| Immigrants | Brazil | 45.4 /100 | #179 | Average 95.7% |
| Iraqis | 40.5 /100 | #180 | Average 95.7% |
| Immigrants | Spain | 38.7 /100 | #181 | Fair 95.7% |
| Immigrants | Egypt | 37.9 /100 | #182 | Fair 95.7% |
| Immigrants | Iraq | 36.2 /100 | #183 | Fair 95.6% |
| Immigrants | Uganda | 36.0 /100 | #184 | Fair 95.6% |
| Blacks/African Americans | 34.8 /100 | #185 | Fair 95.6% |
| Brazilians | 34.8 /100 | #186 | Fair 95.6% |
Demographics Similar to Belgians by 8th Grade
In terms of 8th grade, the demographic groups most similar to Belgians are Latvian (97.0%, a difference of 0.0%), Alaska Native (97.0%, a difference of 0.010%), Luxembourger (97.0%, a difference of 0.020%), British (97.0%, a difference of 0.020%), and Hungarian (97.0%, a difference of 0.020%).
| Demographics | Rating | Rank | 8th Grade |
| Europeans | 100.0 /100 | #29 | Exceptional 97.1% |
| Sioux | 100.0 /100 | #30 | Exceptional 97.1% |
| Chippewa | 100.0 /100 | #31 | Exceptional 97.1% |
| Yup'ik | 100.0 /100 | #32 | Exceptional 97.0% |
| Swiss | 100.0 /100 | #33 | Exceptional 97.0% |
| Luxembourgers | 100.0 /100 | #34 | Exceptional 97.0% |
| Alaska Natives | 100.0 /100 | #35 | Exceptional 97.0% |
| Belgians | 100.0 /100 | #36 | Exceptional 97.0% |
| Latvians | 100.0 /100 | #37 | Exceptional 97.0% |
| British | 100.0 /100 | #38 | Exceptional 97.0% |
| Hungarians | 100.0 /100 | #39 | Exceptional 97.0% |
| Inupiat | 100.0 /100 | #40 | Exceptional 97.0% |
| Eastern Europeans | 100.0 /100 | #41 | Exceptional 97.0% |
| Chinese | 100.0 /100 | #42 | Exceptional 96.9% |
| Aleuts | 99.9 /100 | #43 | Exceptional 96.9% |