Immigrants from Brazil vs Assyrian/Chaldean/Syriac 8th Grade
COMPARE
Immigrants from Brazil
Assyrian/Chaldean/Syriac
8th Grade
8th Grade Comparison
Immigrants from Brazil
Assyrians/Chaldeans/Syriacs
95.7%
8TH GRADE
45.4/ 100
METRIC RATING
179th/ 347
METRIC RANK
95.6%
8TH GRADE
24.5/ 100
METRIC RATING
196th/ 347
METRIC RANK
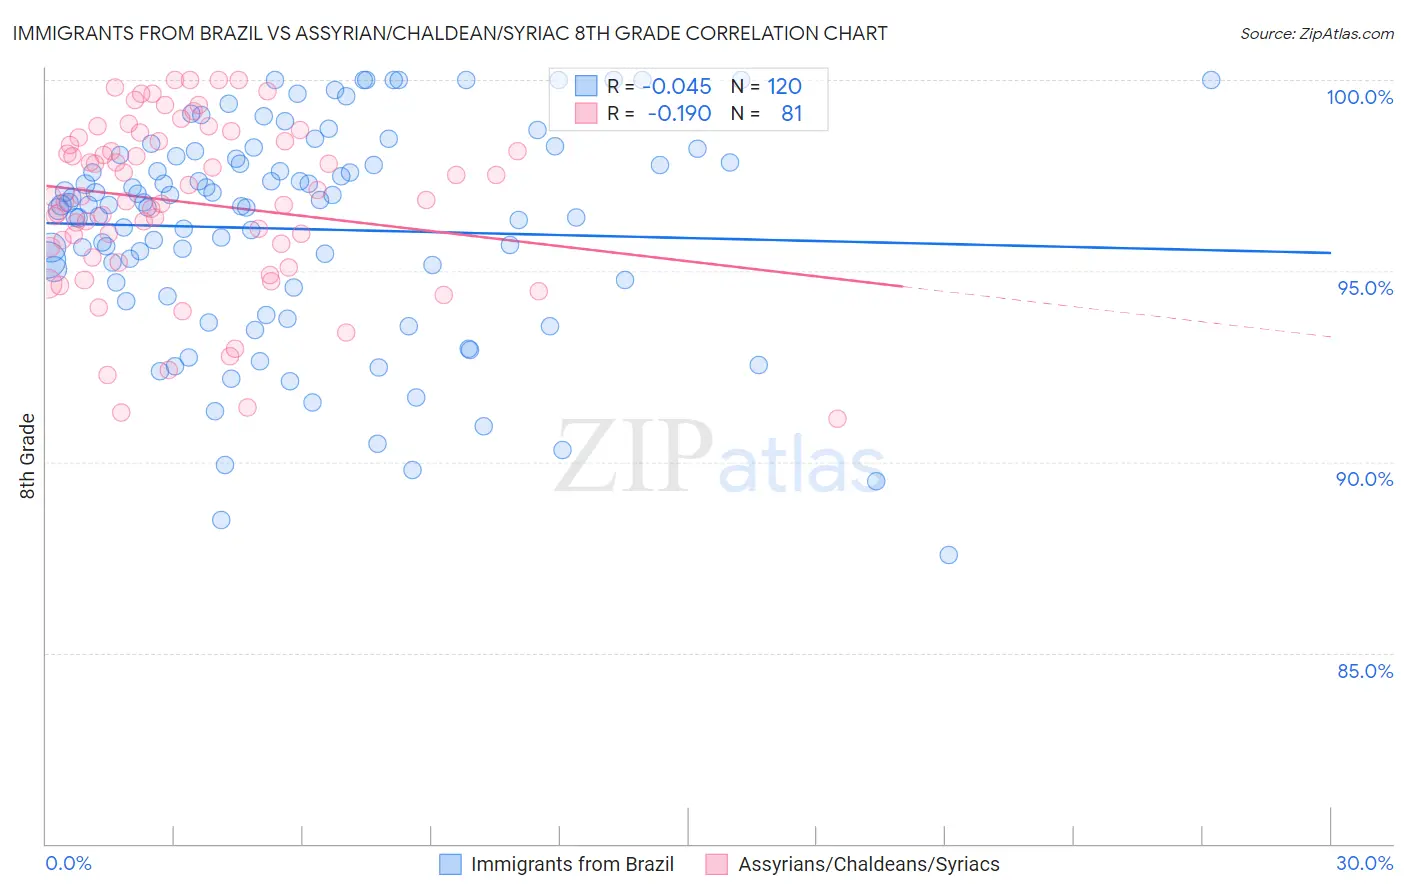
Immigrants from Brazil vs Assyrian/Chaldean/Syriac 8th Grade Correlation Chart
The statistical analysis conducted on geographies consisting of 343,018,979 people shows no correlation between the proportion of Immigrants from Brazil and percentage of population with at least 8th grade education in the United States with a correlation coefficient (R) of -0.045 and weighted average of 95.7%. Similarly, the statistical analysis conducted on geographies consisting of 110,318,304 people shows a poor negative correlation between the proportion of Assyrians/Chaldeans/Syriacs and percentage of population with at least 8th grade education in the United States with a correlation coefficient (R) of -0.190 and weighted average of 95.6%, a difference of 0.15%.
8th Grade Correlation Summary
| Measurement | Immigrants from Brazil | Assyrian/Chaldean/Syriac |
| Minimum | 87.6% | 91.1% |
| Maximum | 100.0% | 100.0% |
| Range | 12.4% | 8.9% |
| Mean | 96.1% | 96.8% |
| Median | 96.7% | 96.9% |
| Interquartile 25% (IQ1) | 94.6% | 95.5% |
| Interquartile 75% (IQ3) | 98.0% | 98.5% |
| Interquartile Range (IQR) | 3.3% | 3.0% |
| Standard Deviation (Sample) | 2.8% | 2.2% |
| Standard Deviation (Population) | 2.8% | 2.2% |
Demographics Similar to Immigrants from Brazil and Assyrians/Chaldeans/Syriacs by 8th Grade
In terms of 8th grade, the demographic groups most similar to Immigrants from Brazil are Marshallese (95.7%, a difference of 0.010%), Venezuelan (95.7%, a difference of 0.010%), Iraqi (95.7%, a difference of 0.030%), Immigrants from Spain (95.7%, a difference of 0.040%), and Immigrants from Egypt (95.7%, a difference of 0.050%). Similarly, the demographic groups most similar to Assyrians/Chaldeans/Syriacs are Sierra Leonean (95.6%, a difference of 0.0%), Immigrants from Zaire (95.6%, a difference of 0.010%), Guamanian/Chamorro (95.6%, a difference of 0.020%), Pima (95.6%, a difference of 0.030%), and Panamanian (95.6%, a difference of 0.030%).
| Demographics | Rating | Rank | 8th Grade |
| Marshallese | 47.6 /100 | #177 | Average 95.7% |
| Venezuelans | 47.5 /100 | #178 | Average 95.7% |
| Immigrants | Brazil | 45.4 /100 | #179 | Average 95.7% |
| Iraqis | 40.5 /100 | #180 | Average 95.7% |
| Immigrants | Spain | 38.7 /100 | #181 | Fair 95.7% |
| Immigrants | Egypt | 37.9 /100 | #182 | Fair 95.7% |
| Immigrants | Iraq | 36.2 /100 | #183 | Fair 95.6% |
| Immigrants | Uganda | 36.0 /100 | #184 | Fair 95.6% |
| Blacks/African Americans | 34.8 /100 | #185 | Fair 95.6% |
| Brazilians | 34.8 /100 | #186 | Fair 95.6% |
| Sudanese | 33.0 /100 | #187 | Fair 95.6% |
| Liberians | 32.4 /100 | #188 | Fair 95.6% |
| Immigrants | Micronesia | 31.6 /100 | #189 | Fair 95.6% |
| Immigrants | Venezuela | 30.8 /100 | #190 | Fair 95.6% |
| Immigrants | Nepal | 30.2 /100 | #191 | Fair 95.6% |
| Pima | 28.6 /100 | #192 | Fair 95.6% |
| Panamanians | 28.4 /100 | #193 | Fair 95.6% |
| Guamanians/Chamorros | 26.6 /100 | #194 | Fair 95.6% |
| Immigrants | Zaire | 25.2 /100 | #195 | Fair 95.6% |
| Assyrians/Chaldeans/Syriacs | 24.5 /100 | #196 | Fair 95.6% |
| Sierra Leoneans | 24.3 /100 | #197 | Fair 95.6% |