Immigrants from Bosnia and Herzegovina vs Immigrants from Ghana GED/Equivalency
COMPARE
Immigrants from Bosnia and Herzegovina
Immigrants from Ghana
GED/Equivalency
GED/Equivalency Comparison
Immigrants from Bosnia and Herzegovina
Immigrants from Ghana
86.3%
GED/EQUIVALENCY
77.9/ 100
METRIC RATING
151st/ 347
METRIC RANK
83.9%
GED/EQUIVALENCY
1.3/ 100
METRIC RATING
244th/ 347
METRIC RANK
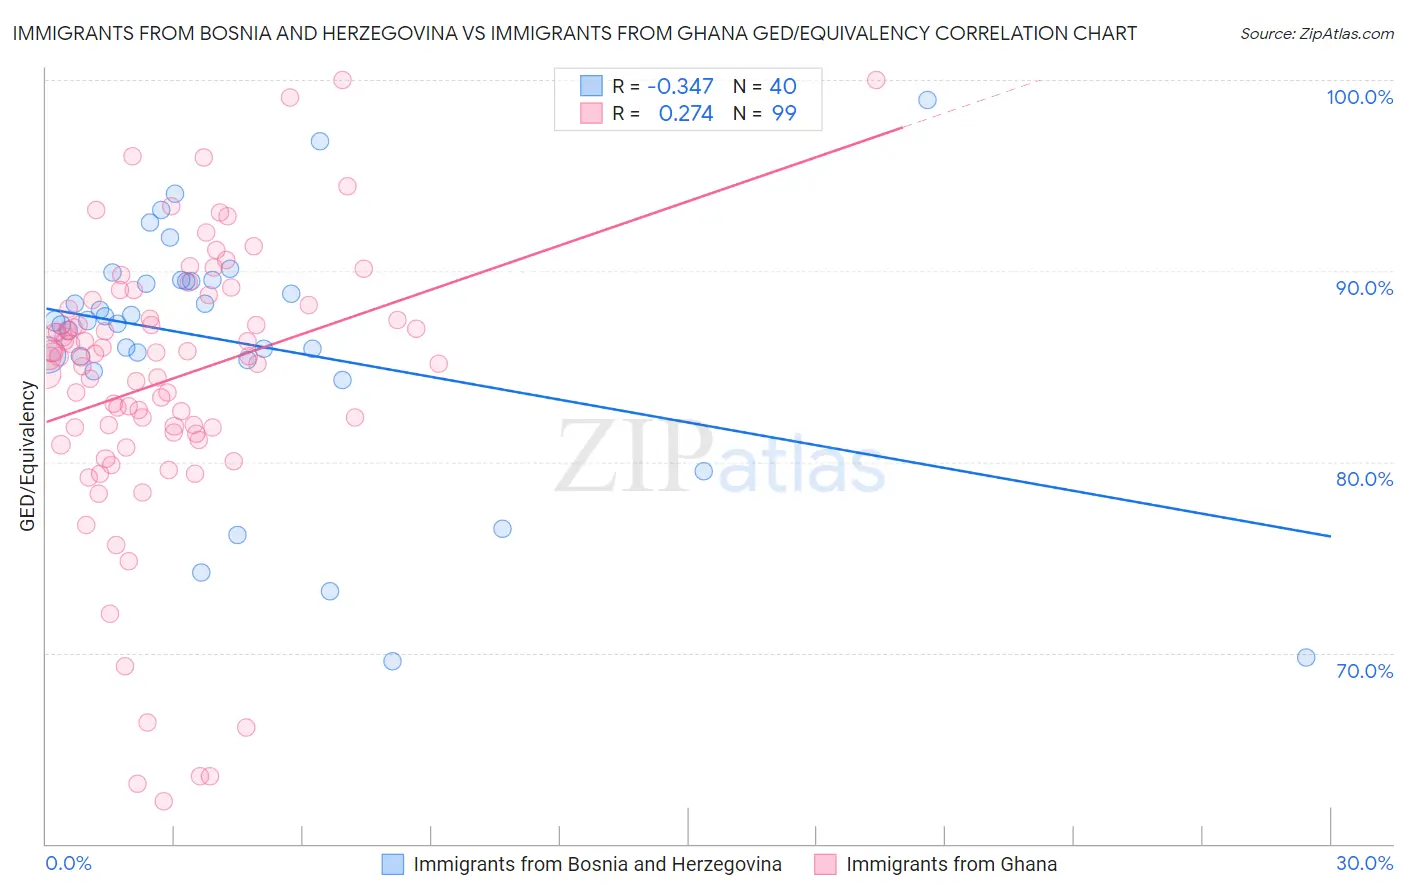
Immigrants from Bosnia and Herzegovina vs Immigrants from Ghana GED/Equivalency Correlation Chart
The statistical analysis conducted on geographies consisting of 156,819,615 people shows a mild negative correlation between the proportion of Immigrants from Bosnia and Herzegovina and percentage of population with at least ged/equivalency education in the United States with a correlation coefficient (R) of -0.347 and weighted average of 86.3%. Similarly, the statistical analysis conducted on geographies consisting of 199,951,982 people shows a weak positive correlation between the proportion of Immigrants from Ghana and percentage of population with at least ged/equivalency education in the United States with a correlation coefficient (R) of 0.274 and weighted average of 83.9%, a difference of 2.9%.
GED/Equivalency Correlation Summary
| Measurement | Immigrants from Bosnia and Herzegovina | Immigrants from Ghana |
| Minimum | 69.6% | 62.2% |
| Maximum | 98.9% | 100.0% |
| Range | 29.4% | 37.8% |
| Mean | 86.2% | 84.3% |
| Median | 87.4% | 85.5% |
| Interquartile 25% (IQ1) | 85.4% | 81.6% |
| Interquartile 75% (IQ3) | 89.5% | 88.2% |
| Interquartile Range (IQR) | 4.0% | 6.7% |
| Standard Deviation (Sample) | 6.5% | 7.4% |
| Standard Deviation (Population) | 6.5% | 7.4% |
Similar Demographics by GED/Equivalency
Demographics Similar to Immigrants from Bosnia and Herzegovina by GED/Equivalency
In terms of ged/equivalency, the demographic groups most similar to Immigrants from Bosnia and Herzegovina are Brazilian (86.3%, a difference of 0.020%), Immigrants from Western Asia (86.3%, a difference of 0.030%), Immigrants from Northern Africa (86.3%, a difference of 0.040%), Immigrants from Poland (86.3%, a difference of 0.040%), and Menominee (86.3%, a difference of 0.040%).
| Demographics | Rating | Rank | GED/Equivalency |
| Bolivians | 82.1 /100 | #144 | Excellent 86.4% |
| Pakistanis | 80.4 /100 | #145 | Excellent 86.4% |
| Basques | 79.5 /100 | #146 | Good 86.4% |
| Immigrants | Northern Africa | 79.3 /100 | #147 | Good 86.3% |
| Immigrants | Poland | 79.3 /100 | #148 | Good 86.3% |
| Menominee | 79.3 /100 | #149 | Good 86.3% |
| Immigrants | Western Asia | 78.8 /100 | #150 | Good 86.3% |
| Immigrants | Bosnia and Herzegovina | 77.9 /100 | #151 | Good 86.3% |
| Brazilians | 77.2 /100 | #152 | Good 86.3% |
| Kenyans | 76.6 /100 | #153 | Good 86.3% |
| Armenians | 76.4 /100 | #154 | Good 86.3% |
| Iraqis | 75.2 /100 | #155 | Good 86.2% |
| Immigrants | Nepal | 73.3 /100 | #156 | Good 86.2% |
| Whites/Caucasians | 72.2 /100 | #157 | Good 86.2% |
| German Russians | 72.1 /100 | #158 | Good 86.2% |
Demographics Similar to Immigrants from Ghana by GED/Equivalency
In terms of ged/equivalency, the demographic groups most similar to Immigrants from Ghana are Cherokee (83.9%, a difference of 0.010%), Immigrants from Senegal (83.8%, a difference of 0.030%), Chickasaw (83.8%, a difference of 0.050%), Immigrants from Western Africa (83.8%, a difference of 0.090%), and Blackfeet (83.8%, a difference of 0.10%).
| Demographics | Rating | Rank | GED/Equivalency |
| Sub-Saharan Africans | 3.0 /100 | #237 | Tragic 84.2% |
| Immigrants | Peru | 2.7 /100 | #238 | Tragic 84.2% |
| Immigrants | Bahamas | 2.6 /100 | #239 | Tragic 84.2% |
| Immigrants | South Eastern Asia | 2.5 /100 | #240 | Tragic 84.1% |
| Senegalese | 1.9 /100 | #241 | Tragic 84.0% |
| Sri Lankans | 1.9 /100 | #242 | Tragic 84.0% |
| Cherokee | 1.3 /100 | #243 | Tragic 83.9% |
| Immigrants | Ghana | 1.3 /100 | #244 | Tragic 83.9% |
| Immigrants | Senegal | 1.2 /100 | #245 | Tragic 83.8% |
| Chickasaw | 1.2 /100 | #246 | Tragic 83.8% |
| Immigrants | Western Africa | 1.1 /100 | #247 | Tragic 83.8% |
| Blackfeet | 1.1 /100 | #248 | Tragic 83.8% |
| Crow | 1.1 /100 | #249 | Tragic 83.8% |
| Shoshone | 1.0 /100 | #250 | Tragic 83.7% |
| Spanish Americans | 0.8 /100 | #251 | Tragic 83.6% |