Immigrants from Belize vs Immigrants from Singapore 1st Grade
COMPARE
Immigrants from Belize
Immigrants from Singapore
1st Grade
1st Grade Comparison
Immigrants from Belize
Immigrants from Singapore
96.9%
1ST GRADE
0.0/ 100
METRIC RATING
315th/ 347
METRIC RANK
98.2%
1ST GRADE
96.7/ 100
METRIC RATING
110th/ 347
METRIC RANK
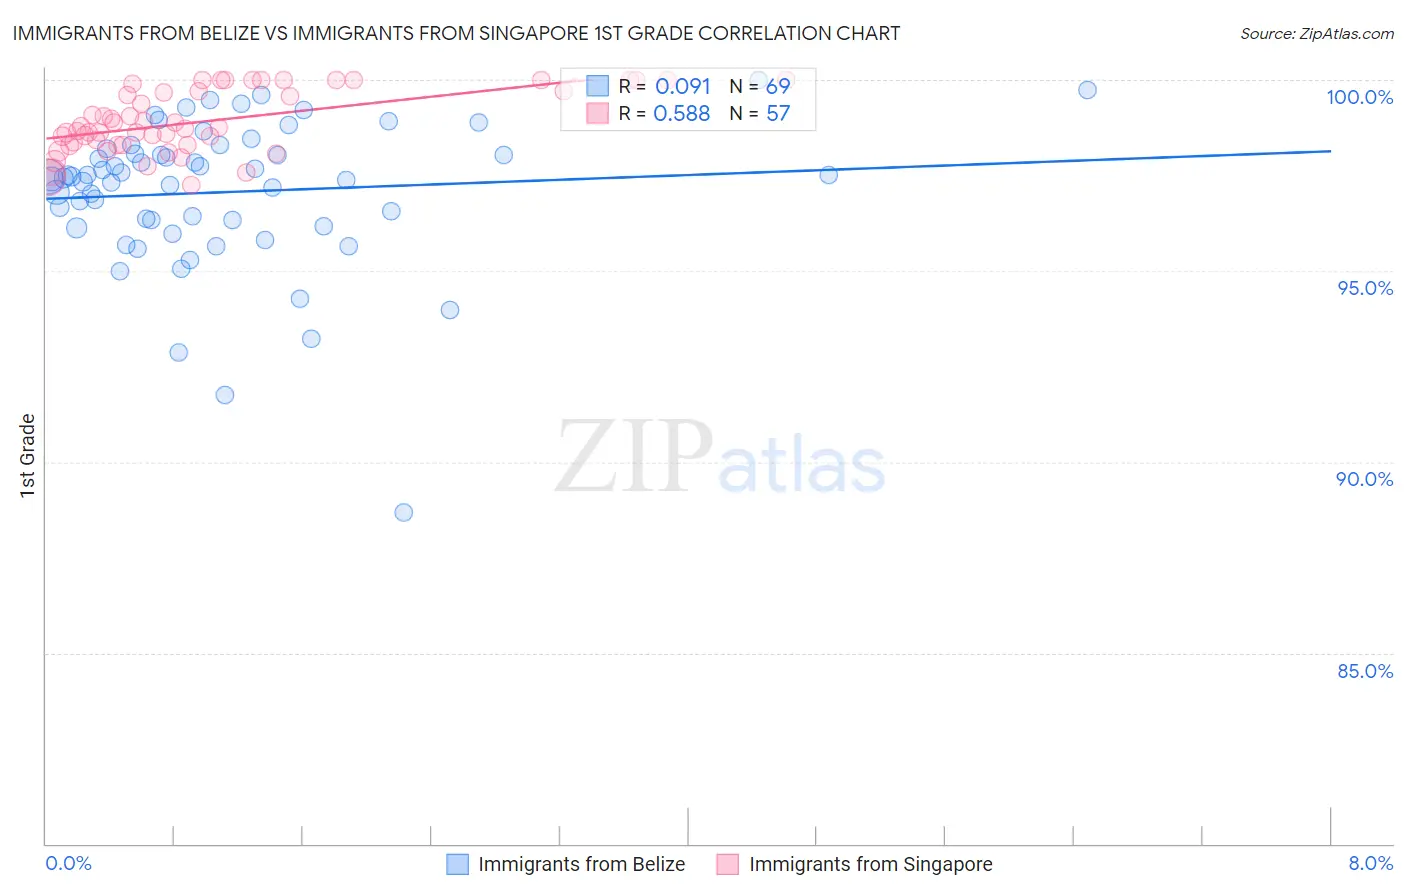
Immigrants from Belize vs Immigrants from Singapore 1st Grade Correlation Chart
The statistical analysis conducted on geographies consisting of 130,328,311 people shows a slight positive correlation between the proportion of Immigrants from Belize and percentage of population with at least 1st grade education in the United States with a correlation coefficient (R) of 0.091 and weighted average of 96.9%. Similarly, the statistical analysis conducted on geographies consisting of 137,521,700 people shows a substantial positive correlation between the proportion of Immigrants from Singapore and percentage of population with at least 1st grade education in the United States with a correlation coefficient (R) of 0.588 and weighted average of 98.2%, a difference of 1.3%.
1st Grade Correlation Summary
| Measurement | Immigrants from Belize | Immigrants from Singapore |
| Minimum | 88.7% | 97.2% |
| Maximum | 100.0% | 100.0% |
| Range | 11.3% | 2.8% |
| Mean | 97.1% | 98.9% |
| Median | 97.5% | 98.7% |
| Interquartile 25% (IQ1) | 96.2% | 98.3% |
| Interquartile 75% (IQ3) | 98.1% | 99.8% |
| Interquartile Range (IQR) | 1.9% | 1.5% |
| Standard Deviation (Sample) | 1.9% | 0.81% |
| Standard Deviation (Population) | 1.9% | 0.81% |
Similar Demographics by 1st Grade
Demographics Similar to Immigrants from Belize by 1st Grade
In terms of 1st grade, the demographic groups most similar to Immigrants from Belize are Honduran (96.9%, a difference of 0.010%), Immigrants from Ecuador (96.9%, a difference of 0.010%), Immigrants from Nicaragua (96.9%, a difference of 0.010%), Cape Verdean (96.9%, a difference of 0.030%), and Guyanese (96.9%, a difference of 0.030%).
| Demographics | Rating | Rank | 1st Grade |
| Hispanics or Latinos | 0.0 /100 | #308 | Tragic 96.9% |
| Immigrants | Haiti | 0.0 /100 | #309 | Tragic 96.9% |
| Immigrants | Azores | 0.0 /100 | #310 | Tragic 96.9% |
| Sri Lankans | 0.0 /100 | #311 | Tragic 96.9% |
| Cape Verdeans | 0.0 /100 | #312 | Tragic 96.9% |
| Guyanese | 0.0 /100 | #313 | Tragic 96.9% |
| Hondurans | 0.0 /100 | #314 | Tragic 96.9% |
| Immigrants | Belize | 0.0 /100 | #315 | Tragic 96.9% |
| Immigrants | Ecuador | 0.0 /100 | #316 | Tragic 96.9% |
| Immigrants | Nicaragua | 0.0 /100 | #317 | Tragic 96.9% |
| Immigrants | Laos | 0.0 /100 | #318 | Tragic 96.8% |
| Immigrants | Guyana | 0.0 /100 | #319 | Tragic 96.8% |
| Immigrants | Burma/Myanmar | 0.0 /100 | #320 | Tragic 96.8% |
| Immigrants | Bangladesh | 0.0 /100 | #321 | Tragic 96.8% |
| Mexican American Indians | 0.0 /100 | #322 | Tragic 96.8% |
Demographics Similar to Immigrants from Singapore by 1st Grade
In terms of 1st grade, the demographic groups most similar to Immigrants from Singapore are Immigrants from Czechoslovakia (98.2%, a difference of 0.0%), Immigrants from Norway (98.2%, a difference of 0.0%), German Russian (98.2%, a difference of 0.010%), Immigrants from Latvia (98.2%, a difference of 0.010%), and Ute (98.2%, a difference of 0.010%).
| Demographics | Rating | Rank | 1st Grade |
| Immigrants | Ireland | 97.7 /100 | #103 | Exceptional 98.2% |
| Pima | 97.5 /100 | #104 | Exceptional 98.2% |
| Basques | 97.4 /100 | #105 | Exceptional 98.2% |
| Turks | 97.4 /100 | #106 | Exceptional 98.2% |
| Immigrants | Switzerland | 97.3 /100 | #107 | Exceptional 98.2% |
| Bhutanese | 97.3 /100 | #108 | Exceptional 98.2% |
| German Russians | 97.1 /100 | #109 | Exceptional 98.2% |
| Immigrants | Singapore | 96.7 /100 | #110 | Exceptional 98.2% |
| Immigrants | Czechoslovakia | 96.6 /100 | #111 | Exceptional 98.2% |
| Immigrants | Norway | 96.6 /100 | #112 | Exceptional 98.2% |
| Immigrants | Latvia | 96.4 /100 | #113 | Exceptional 98.2% |
| Ute | 96.2 /100 | #114 | Exceptional 98.2% |
| Iranians | 96.0 /100 | #115 | Exceptional 98.2% |
| Spanish | 95.9 /100 | #116 | Exceptional 98.2% |
| Yugoslavians | 95.5 /100 | #117 | Exceptional 98.2% |