Immigrants from Belize vs Immigrants from Poland 1st Grade
COMPARE
Immigrants from Belize
Immigrants from Poland
1st Grade
1st Grade Comparison
Immigrants from Belize
Immigrants from Poland
96.9%
1ST GRADE
0.0/ 100
METRIC RATING
315th/ 347
METRIC RANK
97.9%
1ST GRADE
40.1/ 100
METRIC RATING
184th/ 347
METRIC RANK
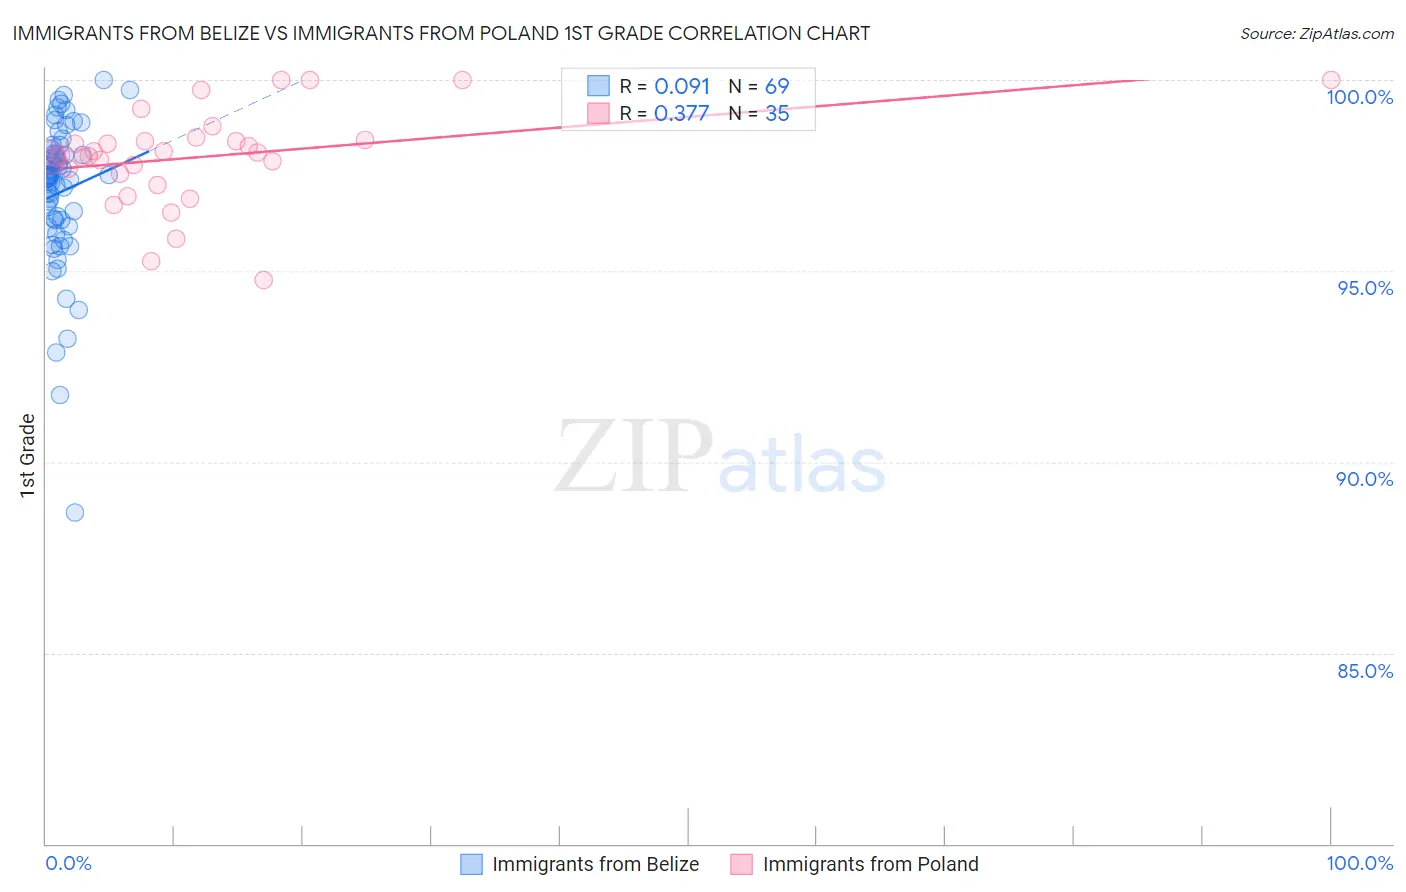
Immigrants from Belize vs Immigrants from Poland 1st Grade Correlation Chart
The statistical analysis conducted on geographies consisting of 130,328,311 people shows a slight positive correlation between the proportion of Immigrants from Belize and percentage of population with at least 1st grade education in the United States with a correlation coefficient (R) of 0.091 and weighted average of 96.9%. Similarly, the statistical analysis conducted on geographies consisting of 304,861,559 people shows a mild positive correlation between the proportion of Immigrants from Poland and percentage of population with at least 1st grade education in the United States with a correlation coefficient (R) of 0.377 and weighted average of 97.9%, a difference of 1.1%.
1st Grade Correlation Summary
| Measurement | Immigrants from Belize | Immigrants from Poland |
| Minimum | 88.7% | 94.8% |
| Maximum | 100.0% | 100.0% |
| Range | 11.3% | 5.2% |
| Mean | 97.1% | 98.0% |
| Median | 97.5% | 98.0% |
| Interquartile 25% (IQ1) | 96.2% | 97.5% |
| Interquartile 75% (IQ3) | 98.1% | 98.4% |
| Interquartile Range (IQR) | 1.9% | 0.89% |
| Standard Deviation (Sample) | 1.9% | 1.2% |
| Standard Deviation (Population) | 1.9% | 1.2% |
Similar Demographics by 1st Grade
Demographics Similar to Immigrants from Belize by 1st Grade
In terms of 1st grade, the demographic groups most similar to Immigrants from Belize are Honduran (96.9%, a difference of 0.010%), Immigrants from Ecuador (96.9%, a difference of 0.010%), Immigrants from Nicaragua (96.9%, a difference of 0.010%), Cape Verdean (96.9%, a difference of 0.030%), and Guyanese (96.9%, a difference of 0.030%).
| Demographics | Rating | Rank | 1st Grade |
| Hispanics or Latinos | 0.0 /100 | #308 | Tragic 96.9% |
| Immigrants | Haiti | 0.0 /100 | #309 | Tragic 96.9% |
| Immigrants | Azores | 0.0 /100 | #310 | Tragic 96.9% |
| Sri Lankans | 0.0 /100 | #311 | Tragic 96.9% |
| Cape Verdeans | 0.0 /100 | #312 | Tragic 96.9% |
| Guyanese | 0.0 /100 | #313 | Tragic 96.9% |
| Hondurans | 0.0 /100 | #314 | Tragic 96.9% |
| Immigrants | Belize | 0.0 /100 | #315 | Tragic 96.9% |
| Immigrants | Ecuador | 0.0 /100 | #316 | Tragic 96.9% |
| Immigrants | Nicaragua | 0.0 /100 | #317 | Tragic 96.9% |
| Immigrants | Laos | 0.0 /100 | #318 | Tragic 96.8% |
| Immigrants | Guyana | 0.0 /100 | #319 | Tragic 96.8% |
| Immigrants | Burma/Myanmar | 0.0 /100 | #320 | Tragic 96.8% |
| Immigrants | Bangladesh | 0.0 /100 | #321 | Tragic 96.8% |
| Mexican American Indians | 0.0 /100 | #322 | Tragic 96.8% |
Demographics Similar to Immigrants from Poland by 1st Grade
In terms of 1st grade, the demographic groups most similar to Immigrants from Poland are Immigrants from Argentina (97.9%, a difference of 0.0%), Immigrants from Belarus (97.9%, a difference of 0.0%), Portuguese (97.9%, a difference of 0.010%), Egyptian (97.9%, a difference of 0.010%), and Paiute (97.9%, a difference of 0.010%).
| Demographics | Rating | Rank | 1st Grade |
| Immigrants | Brazil | 49.1 /100 | #177 | Average 97.9% |
| Immigrants | Venezuela | 47.8 /100 | #178 | Average 97.9% |
| Argentineans | 47.2 /100 | #179 | Average 97.9% |
| Immigrants | Bosnia and Herzegovina | 46.6 /100 | #180 | Average 97.9% |
| Portuguese | 44.2 /100 | #181 | Average 97.9% |
| Egyptians | 42.7 /100 | #182 | Average 97.9% |
| Immigrants | Argentina | 41.3 /100 | #183 | Average 97.9% |
| Immigrants | Poland | 40.1 /100 | #184 | Average 97.9% |
| Immigrants | Belarus | 39.3 /100 | #185 | Fair 97.9% |
| Paiute | 36.5 /100 | #186 | Fair 97.9% |
| Pakistanis | 35.8 /100 | #187 | Fair 97.9% |
| Arabs | 35.5 /100 | #188 | Fair 97.9% |
| Immigrants | Kazakhstan | 34.9 /100 | #189 | Fair 97.9% |
| Panamanians | 34.1 /100 | #190 | Fair 97.9% |
| Blacks/African Americans | 30.7 /100 | #191 | Fair 97.9% |